

Question: but References Mailings Review View Help Table Design Layout A AalbCcDc Aabbccdc Aabbcc Aalboor AaB 1 Normal 1 No Spac... Heading 1 Heading 2 Title
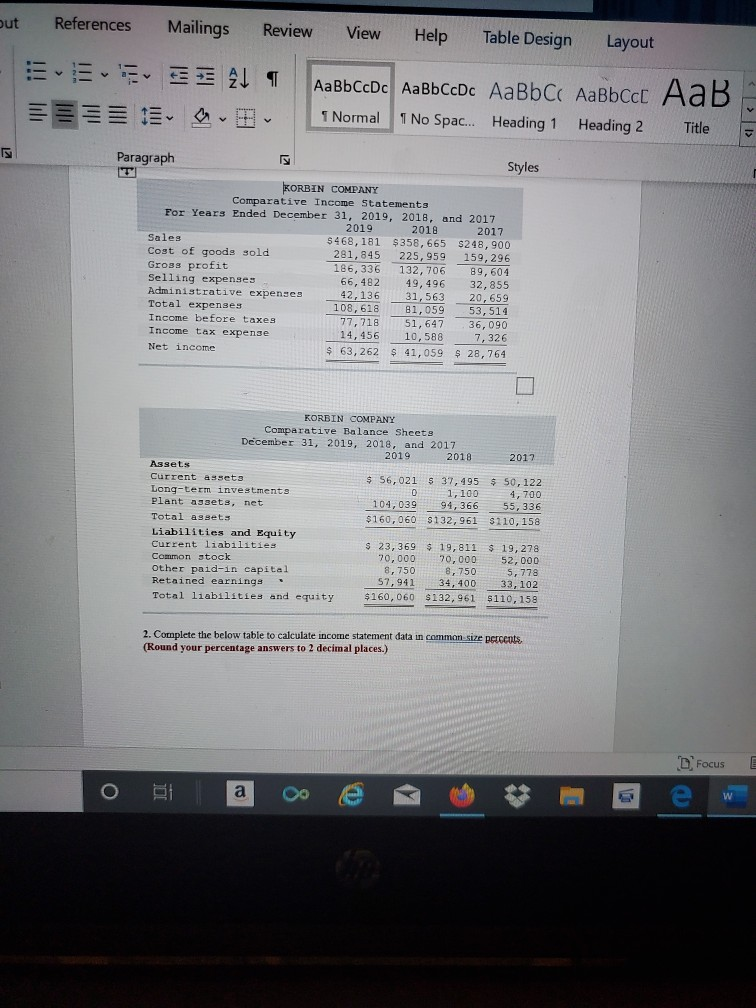
but References Mailings Review View Help Table Design Layout A AalbCcDc Aabbccdc Aabbcc Aalboor AaB 1 Normal 1 No Spac... Heading 1 Heading 2 Title Paragraph Styles KORBIN COMPANY Comparative Income Statements For Years Ended December 31, 2019, 2018, and 2017 2019 2018 2017 Sales 5468,181 $358,665 $248,900 Cost of goods sold 281, 845 225,959 159, 296 Gross profit 186,336 132,706 89, 604 Selling expenses 66, 482 49,496 32,855 Administrative expenses 42, 136 31,56320, 659 Total expenses 108,618 81,059 53,514 Income before taxes 77.218 51, 647 36,090 Income tax expense 14,456 10,588 7, 326 Net income $ 63, 262 $ 41,059 $ 28,764 KORBIN COMPANY Comparative Balance Sheets December 31, 2019, 2018, and 2017 2019 2018 2017 Assets Current assets $ 56,021 S 37,495 $ 50, 122 Long-term investments 1,100 4,700 plant assets, net 104,039 94,366 55,336 Total assets $160,060 $132,961 $210,158 Liabilities and Equity Current liabilities $ 23, 369 $ 19,811 $ 19, 278 Common stock 70,000 70,00052, 000 Other paid-in capital 8,750 8,750S , 778 Retained earnings 57,941 34, 40033, 102 Total liabilities and equity $160,060 $132,961 $110, 158 2. Complete the below table to calculate income statement data in common size percents, (Round your percentage answers to 2 decimal places.) D Focus
Step by Step Solution
There are 3 Steps involved in it

Get step-by-step solutions from verified subject matter experts