

Question: Bxercise Tasks: Follow the directions for each task below and submit your Tableau file ( . twbx ) to elearning to receive credit for the
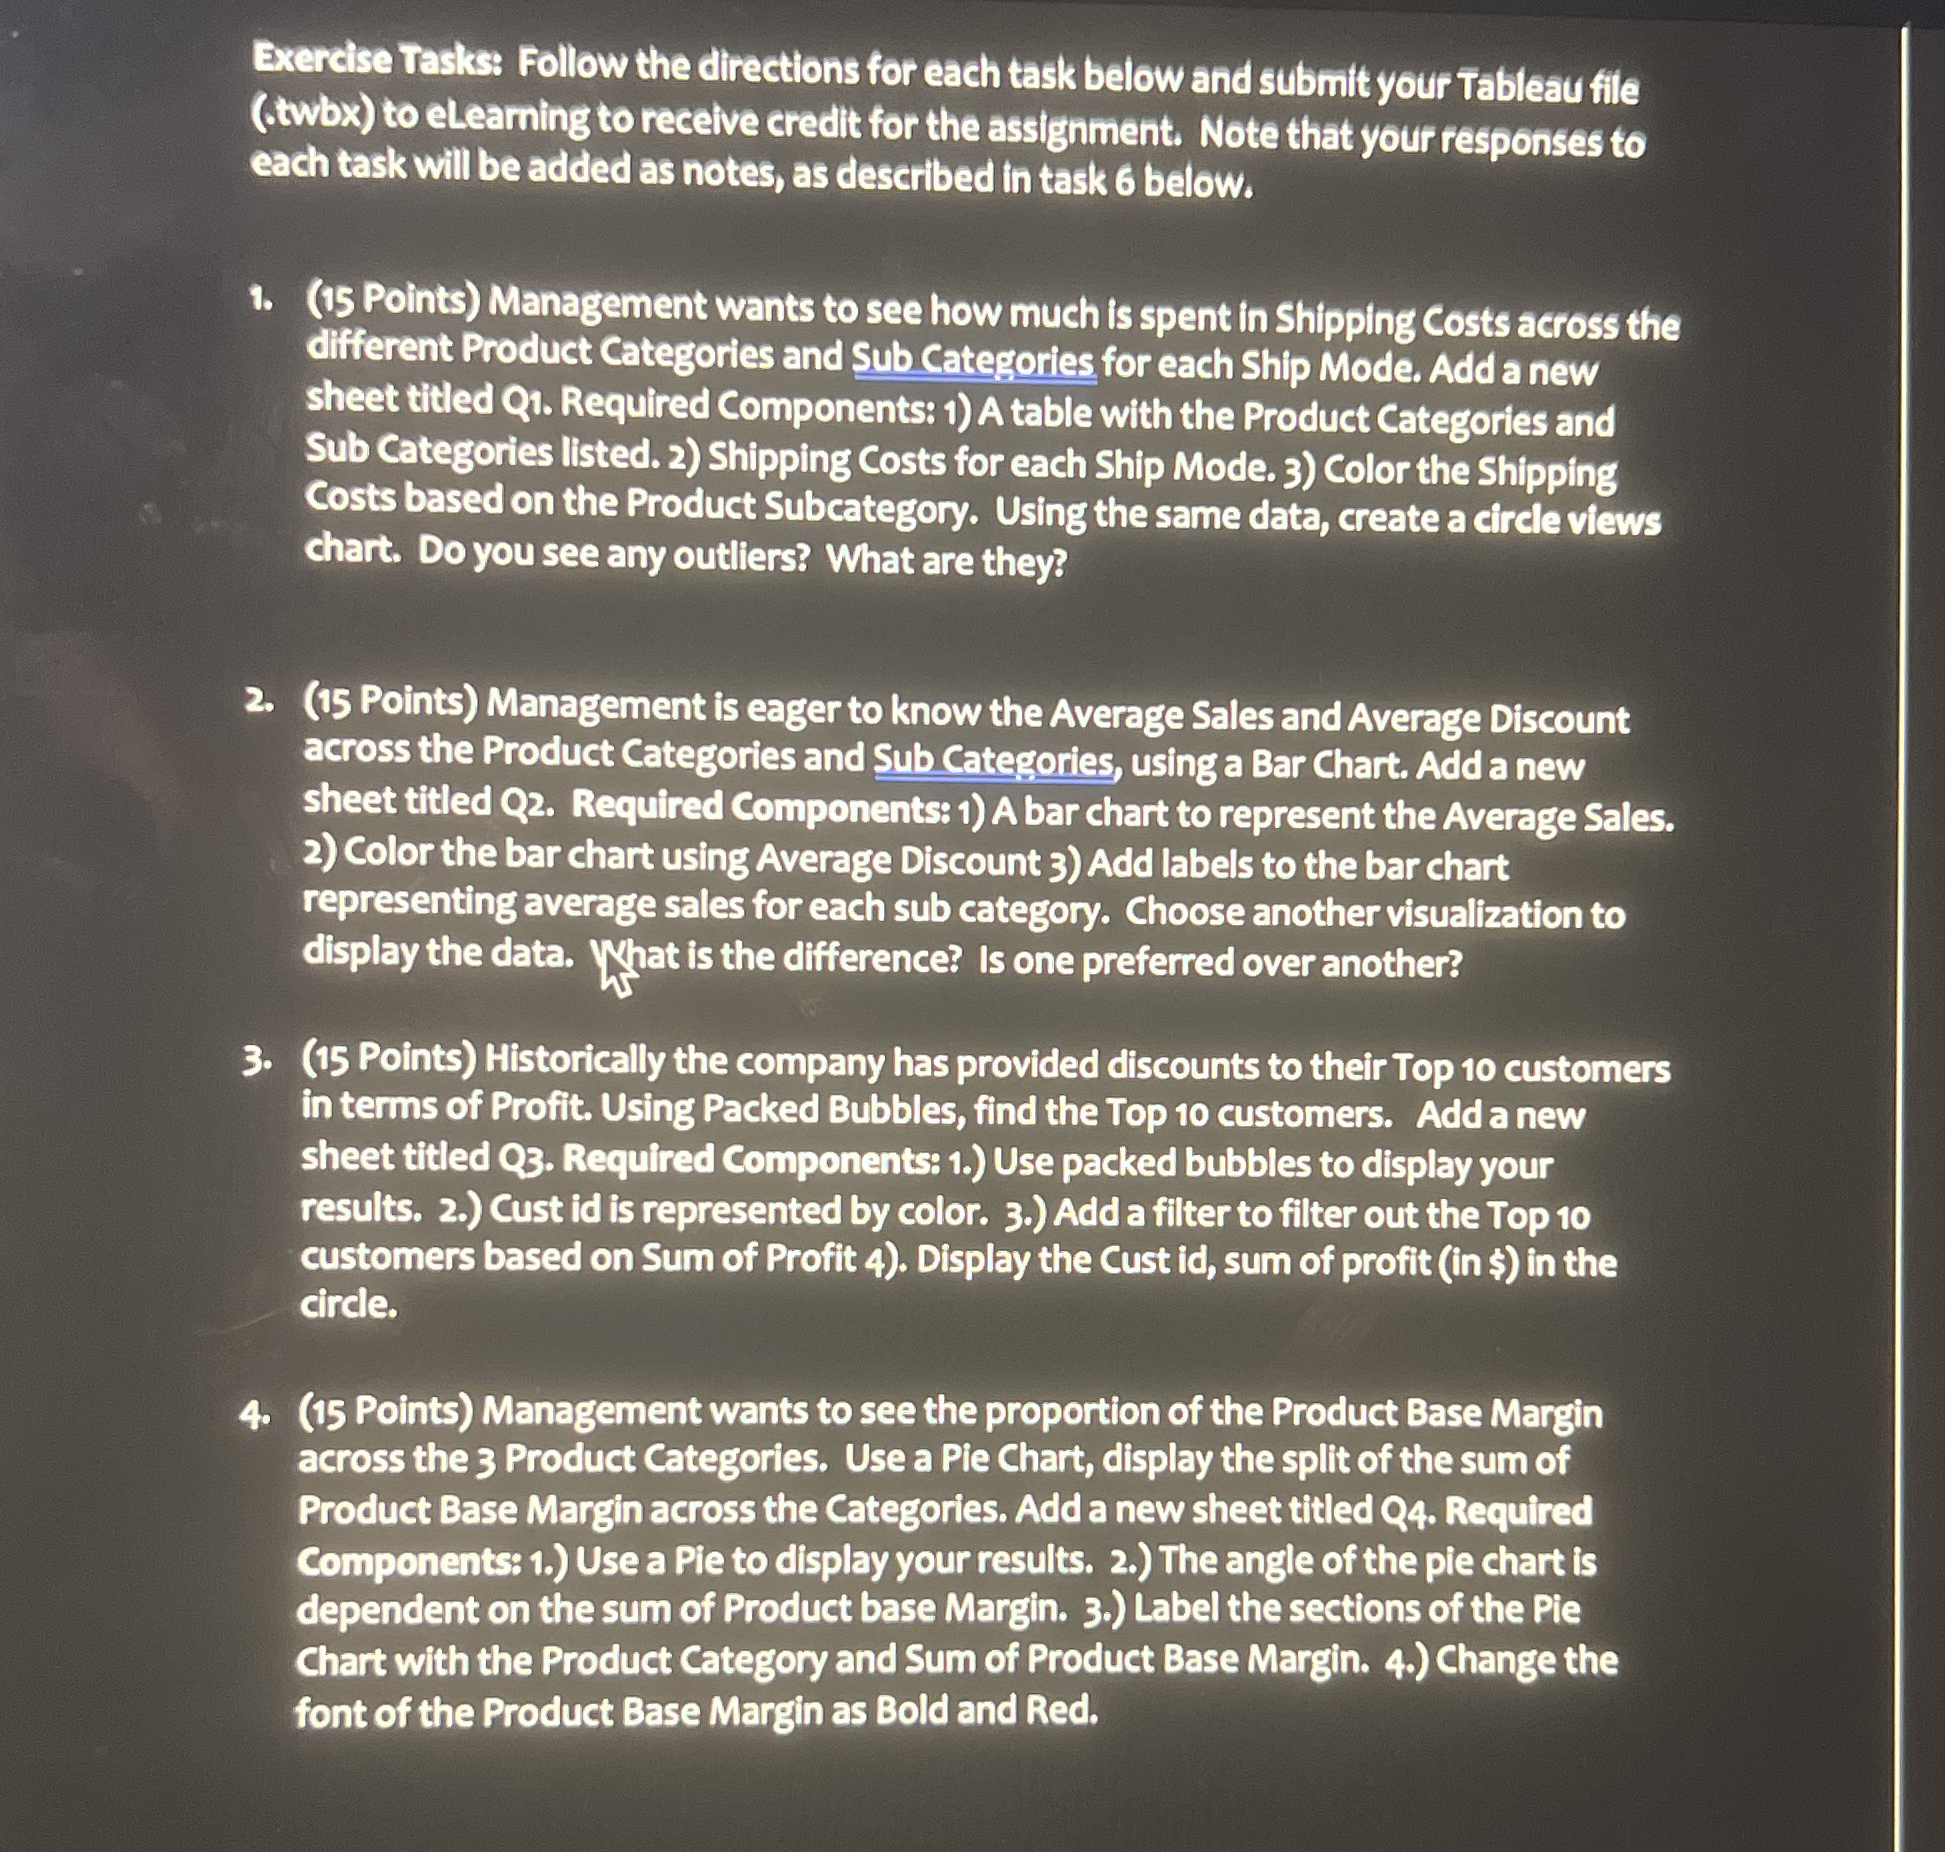
Bxercise Tasks: Follow the directions for each task below and submit your Tableau file twbx to elearning to receive credit for the assignment. Note that your responses to each task will be added as notes, as described in task below.
Points Management wants to see how much is spent in Shipping Costs across the different Product Categories and Sub Categories for each Ship Mode. Add a new sheet titled Q Required Components: A table with the Product Categories and Sub Categories listed. Shipping Costs for each Ship Mode. Color the Shipping Costs based on the Product Subcategory. Using the same data, create a circle views chart. Do you see any outliers? What are they?
Points Management is eager to know the Average Sales and Average Discount across the Product Categories and Sub Categories, using a Bar Chart. Add a new sheet titled Q Required Components: A bar chart to represent the Average Sales. Color the bar chart using Average Discount Add labels to the bar chart representing average sales for each sub category. Choose another visualization to display the data. What is the difference? Is one preferred over another?
Points Historically the company has provided discounts to their Top customers in terms of Profit. Using Packed Bubbles, find the Top customers. Add a new sheet titled Q Required Components: Use packed bubbles to display your results. Cust id is represented by color. Add a filter to filter out the Top customers based on Sum of Profit Display the Cust id sum of profit in $ in the circle.
Points Management wants to see the proportion of the Product Base Margin across the Product Categories. Use a Pie Chart, display the split of the sum of Product Base Margin across the Categories. Add a new sheet titled Q Required Components: Use a Pie to display your results. The angle of the pie chart is dependent on the sum of Product base Margin. Label the sections of the Pie Chart with the Product Category and Sum of Product Base Margin. Change the font of the Product Base Margin as Bold and Red.
Step by Step Solution
There are 3 Steps involved in it
1 Expert Approved Answer
Step: 1 Unlock

Question Has Been Solved by an Expert!
Get step-by-step solutions from verified subject matter experts
Step: 2 Unlock
Step: 3 Unlock