

Question: By comparing the two plots , do you notice any differences in the expected influence of nodes across the two age groups (old age group
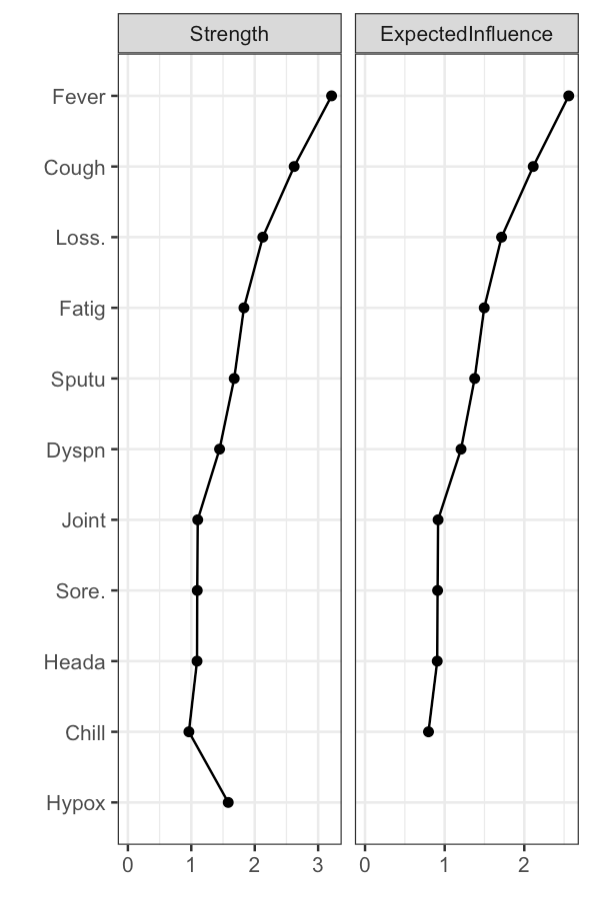
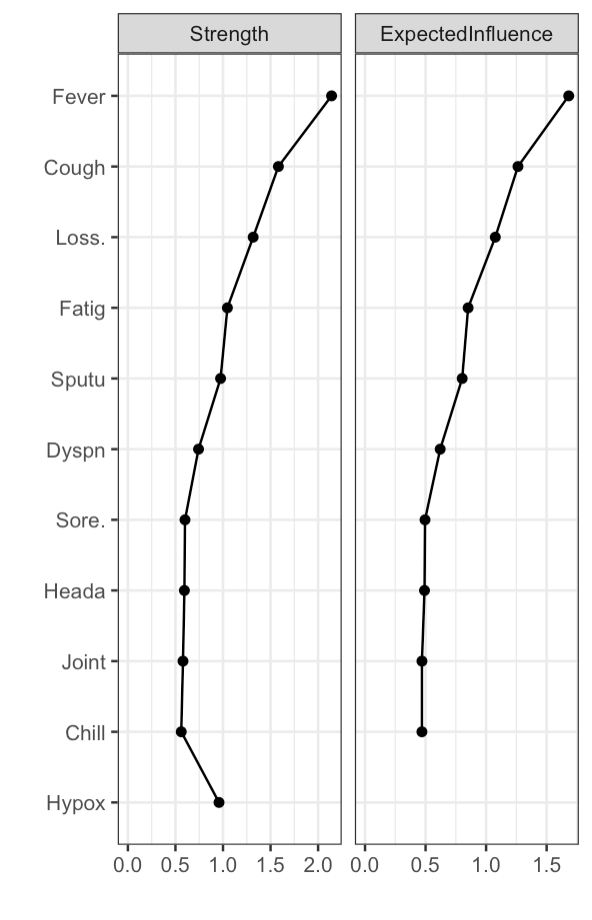
By comparing the two plots , do you notice any differences in the expected influence of nodes across the two age groups (old age group and young age group)? If there are differences, do you consider them to be meaningful or not and why?
old age group:
\f\f
Step by Step Solution
There are 3 Steps involved in it
1 Expert Approved Answer
Step: 1 Unlock

Question Has Been Solved by an Expert!
Get step-by-step solutions from verified subject matter experts
Step: 2 Unlock
Step: 3 Unlock