

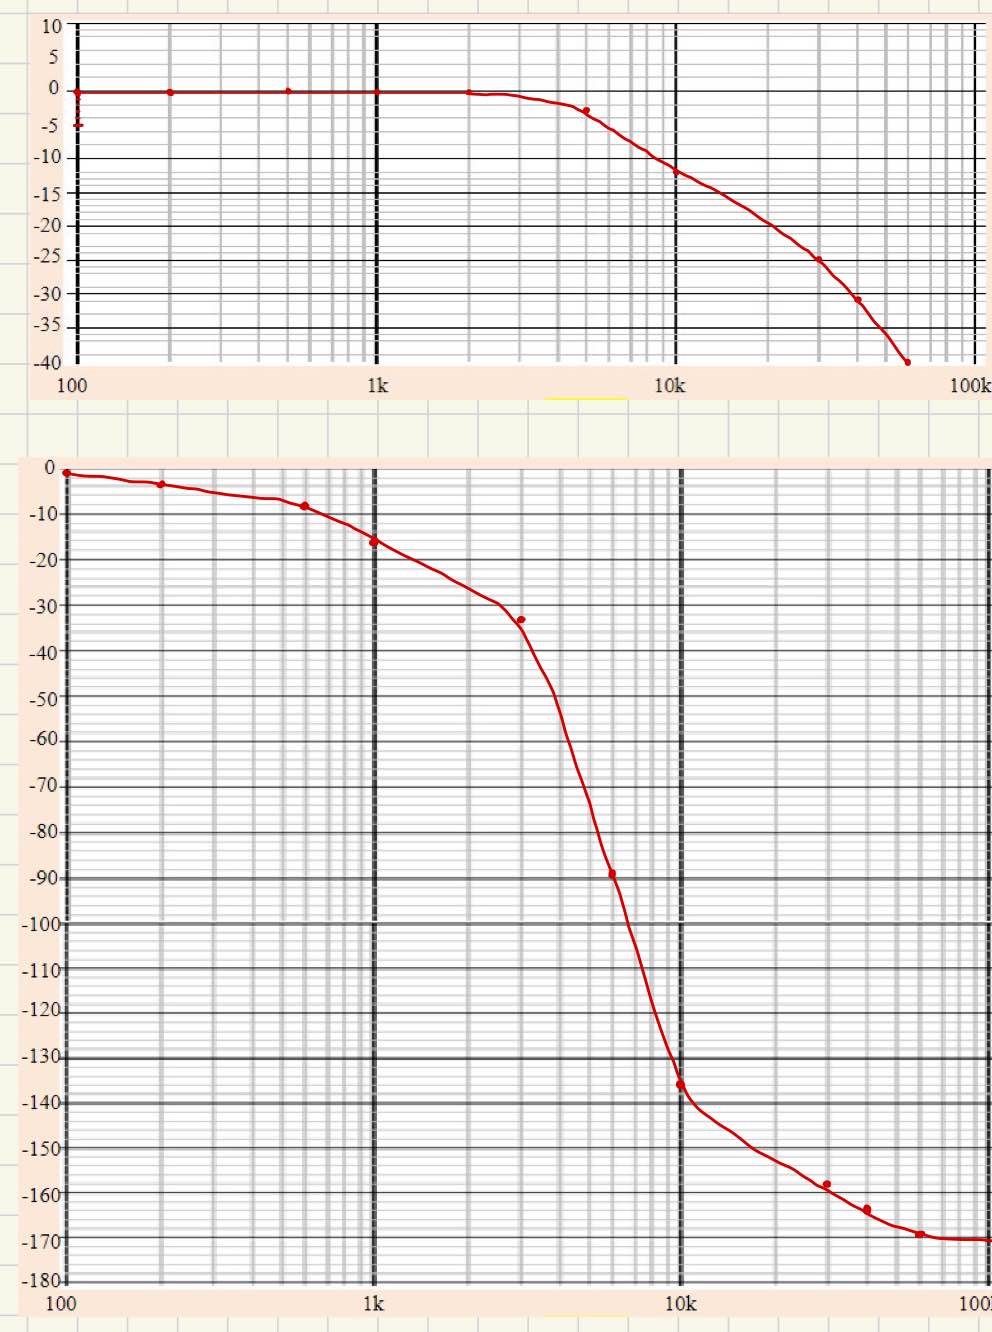
Question: By considering your plots on Graph 1 . 0 and the Multisim plots from prelab, answer the following: a ) How is the maximum rate
By considering your plots on Graph and the Multisim plots from prelab, answer the following:
a How is the maximum rate of attenuation of H affected by Q
b What is so special about the magnitude response when Q
c How do the phase responses compare as a function of Q
Step by Step Solution
There are 3 Steps involved in it
1 Expert Approved Answer
Step: 1 Unlock

Question Has Been Solved by an Expert!
Get step-by-step solutions from verified subject matter experts
Step: 2 Unlock
Step: 3 Unlock