

Question: By looking at the chart above, please explain an analysis of cash flows in terms of realized outcomes vs expected outcomes. If you know more
By looking at the chart above, please explain an analysis of cash flows in terms of realized outcomes vs expected outcomes. If you know more about CAPSIM, please answer your explanation using your knowledge of CAPSIM
https://ww3.capsim.com/guides/capstone_harvard_tmi_2012/the-guide/6-proformas-a-annual-reportsbc9cbc9c.html?start=2
1. Cash Flows from Operations from 2025 to 2026. Write in specific paragraph with explaining the analyses
2. Cash Flows from Investing from 2025 to 2026. Write in specific paragraph with explaining the analyses
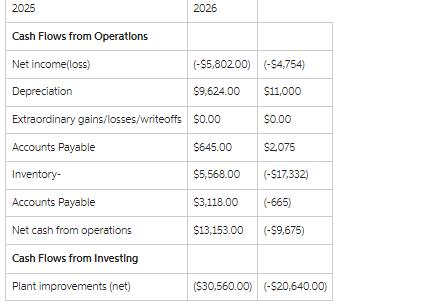
2025 Cash Flows from Operations Net income(loss) Depreciation Extraordinary gains/losses/writeoffs Accounts Payable Inventory- Accounts Payable Net cash from operations. Cash Flows from Investing Plant improvements (net) 2026 (-$5,80200) (-$4,754) $9,624.00 $11,000 $0.00 $645.00 $0.00 $2,075 $5,568.00 (-$17,332) $3,118.00 (-665) $13,153.00 (-$9,675) ($30,560.00) (-$20,640.00)
Step by Step Solution
3.39 Rating (155 Votes )
There are 3 Steps involved in it
S OLUTION Analysis of Cash Flows from Operations 2025 to 2026 The cash flows from operations ... View full answer

Get step-by-step solutions from verified subject matter experts