

Question: By looking at the risks, which ratios showing the weaknesses of the bank and why? ALL RISKS 2021 2020 2019 2018 2017 Credit Risk Measures
By looking at the risks, which ratios showing the weaknesses of the bank and why?
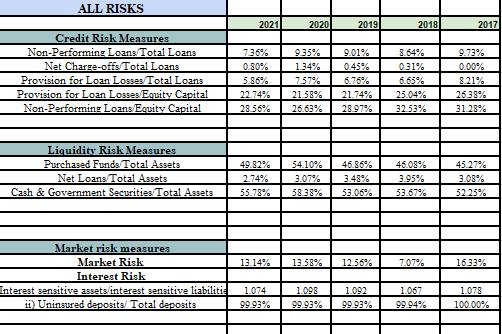
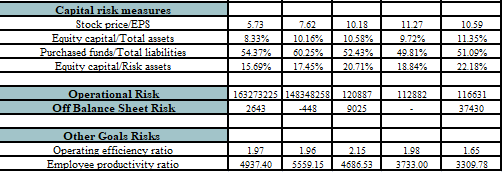
ALL RISKS 2021 2020 2019 2018 2017 Credit Risk Measures Non-Performing Loans Total Loans Net Charge-offs Total Loans Provision for Loan Losses Total Loans Provision for Loan Losses/Equity Capital Non-Performing Loans Equity Capital 736% 0.80% 5.86% 22.74% 28.56% 9.35% 1.34% 7.57% 21.58% 26.63% 9.01% 0.45% 6.76% 21.74% 28.97% 8.64% 0.31% 6,65% 25.04% 32.53% 9.73% 0.00% 8.21% 26.38% 31.28% Liquidity Risk Measures Purchased Funds/Total Assets Net Loans Total Assets Cash & Government Securities Total Assets 49.82% 2.74% 55.78% 54 10% 3.07% 58.38% 46.86% 3.48% 53.06% 46.08% 3.95% 53.67% 45 27% 3.08% 52 25% 13.14% 13.58% 1256% 707% 16.33% Market risk measures Market Risk Interest Risk Interest sensitive assets interest sensitive liabilitie it Uninsured deposits/Total deposits 1.074 99.93% 1.098 99.93% 1.092 99.93% 1.067 99.94% 1.078 100.00% Capital risk measures Stock price EPS Equity capital Total assets Purchased funds Total liabilities Equity capital Risk assets 5.73 8.33% 54.37% 15.69% 7.62 10 16% 60.25% 17.45% 10.18 10.58% 52.43% 20.71% 1127 9.72% 49.81% 18.84% 10.59 11.35% 51.09% 22.18% 112882 Operational Risk Off Balance Sheet Risk 163273225 148348258 120887 2643 -448 9025 116631 37430 Other Goals Risks Operating efficiency ratio Employee productivity ratio 1.97 4937.40 1.96 5559.15 2.15 4686.53 1.98 3783.00 1.65 3309.78
Step by Step Solution
There are 3 Steps involved in it

Get step-by-step solutions from verified subject matter experts