

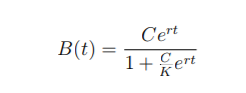
Question: By setting r=1, C=100 and t = 0:20, plot the bacteria growth for K = 1000, K = 3000, and K = 5000. Note that
By setting r=1, C=100 and t = 0:20, plot the bacteria growth for K = 1000, K = 3000, and K = 5000. Note that you will be able to call the bacteria_count function from Q1 within this code to calculate the bacteria population, if you wish to do so.
Each plot must be in the same figure, and should be plotted in the same order specified in the queston.
Function Overview By setting r-1, C-100 and t = 0:20, plot the bacteria growth for K-1000 K-3000, and K = 5000 Note that you will be able to call the bacteria_count function from Q1 within this code to calculate the bacteria population, if you wish to do so. Each plot must be in the same figure, and should be plotted in the same order specified in the queston Function Inputs - none. Function Outputs-none. Function Template function bacteria_plot() C 100 ; r 1, t 0:20; %plot parameters %INSERT CODE HERE end Additional Notes Even though this function has no output, the plots within the function will be marked. Please do not use the figure function in your submission Useful functions include: plot, hold, bacteria_count (see Q1 for info)
Step by Step Solution
There are 3 Steps involved in it

Get step-by-step solutions from verified subject matter experts