

Question: By using R and R studio, how to compare these two part of data and provide data-based arguments to Global warming is not real You
By using R and R studio, how to compare these two part of data and provide data-based arguments to "Global warming is not real"
You should use two of the following techniques to support your arguments:
- hypothesis testing using z-scores and P-values
- hypothesis testing using the Permutation test
- p-hacking(test various variables and sample sizes)
- Bonferroni correction

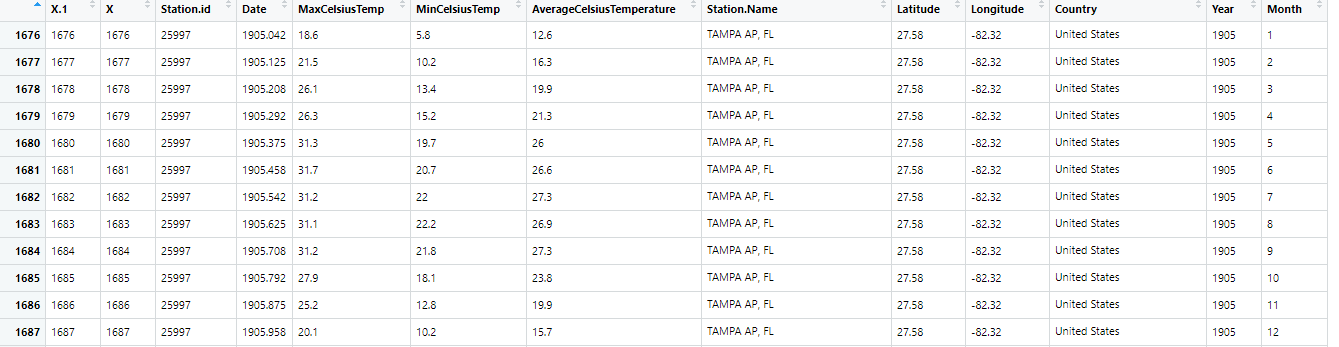
\fX.1 X Station.id Date MaxCelsius Temp MinCelsius Temp AverageCelsiusTemperature Station.Name Latitude Longitude Country Year Month 1676 1676 1676 25997 1905.042 18.6 5.8 12.6 TAMPA AP, FL 27.58 -82.32 United States 1905 1677 1677 1677 25997 1905.125 21.5 10.2 16.3 TAMPA AP, FL 27.58 -82.32 United States 1905 1678 1678 1678 25997 1905.208 26.1 13.4 19.9 TAMPA AP, FL 27.58 -82.32 United States 1905 3 1679 1679 1679 25997 1905.292 26.3 15.2 21.3 TAMPA AP, FL 27.58 -82.32 United States 1905 1680 1680 1680 25997 1905.375 31.3 19.7 26 TAMPA AP, FL 27.58 -82.32 United States 1905 UT 1681 1681 1681 25997 1905.458 31.7 20.7 26.6 TAMPA AP, FL 27.58 -82.32 United States 1905 1682 1682 1682 25997 1905.542 31.2 22 27.3 TAMPA AP, FL 27.58 -82.32 United States 1905 7 1683 1683 1683 25997 1905.625 31.1 22.2 26.9 TAMPA AP, FL 27.58 -82.32 United States 1905 8 1684 1684 1684 25997 1905.708 31.2 21.8 27.3 TAMPA AP, FL 27.58 -82.32 United States 1905 1685 1685 1685 25997 1905.792 27.9 18.1 23.8 TAMPA AP, FL 27.58 -82.32 United States 1905 10 1686 1686 1686 25997 1905.875 25.2 12.8 19.9 TAMPA AP, FL 27.58 -82.32 United States 1905 11 1687 1687 1687 25997 1905.958 20.1 10.2 15.7 TAMPA AP, FL 27.58 -82.32 United States 1905 12
Step by Step Solution
There are 3 Steps involved in it

Get step-by-step solutions from verified subject matter experts