

Question: by using R Programming I need just an interpretation of My code output, My data are a chemical composition of Ni and Co in different
 by using R Programming
I need just an interpretation of My code output, My data are a chemical composition of Ni and Co in different rock units

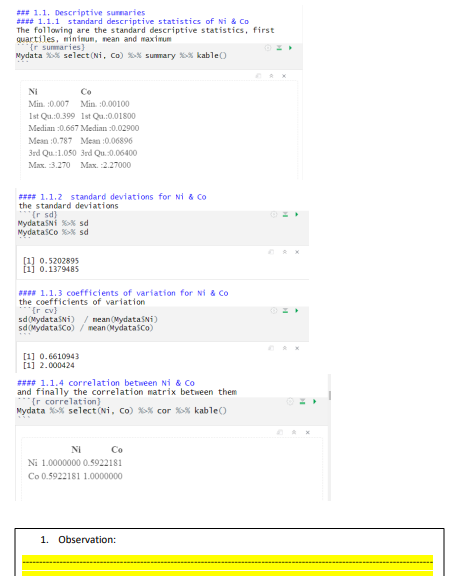
\#f: 1.1, Descriptive sunnaries \#at 1.1.1 standard descriptive statistics of Ni &Co The following are the standard descriptive statistics, first. quartiles, ginimus, nean and maximun \{r sumaries\} Nydata % st select (Ni, Co) Hosk sumary Sos kable O \#f: 1.1, Descriptive sunnaries \#at 1.1.1 standard descriptive statistics of Ni &Co The following are the standard descriptive statistics, first. quartiles, ginimus, nean and maximun \{r sumaries\} Nydata % st select (Ni, Co) Hosk sumary Sos kable O
Step by Step Solution
There are 3 Steps involved in it

Get step-by-step solutions from verified subject matter experts