

Question: by using this data calculate the mean and std deviation of absorbance readings(absorbance reading 1,2,3) and draw the calibration curve using concentration of standards and
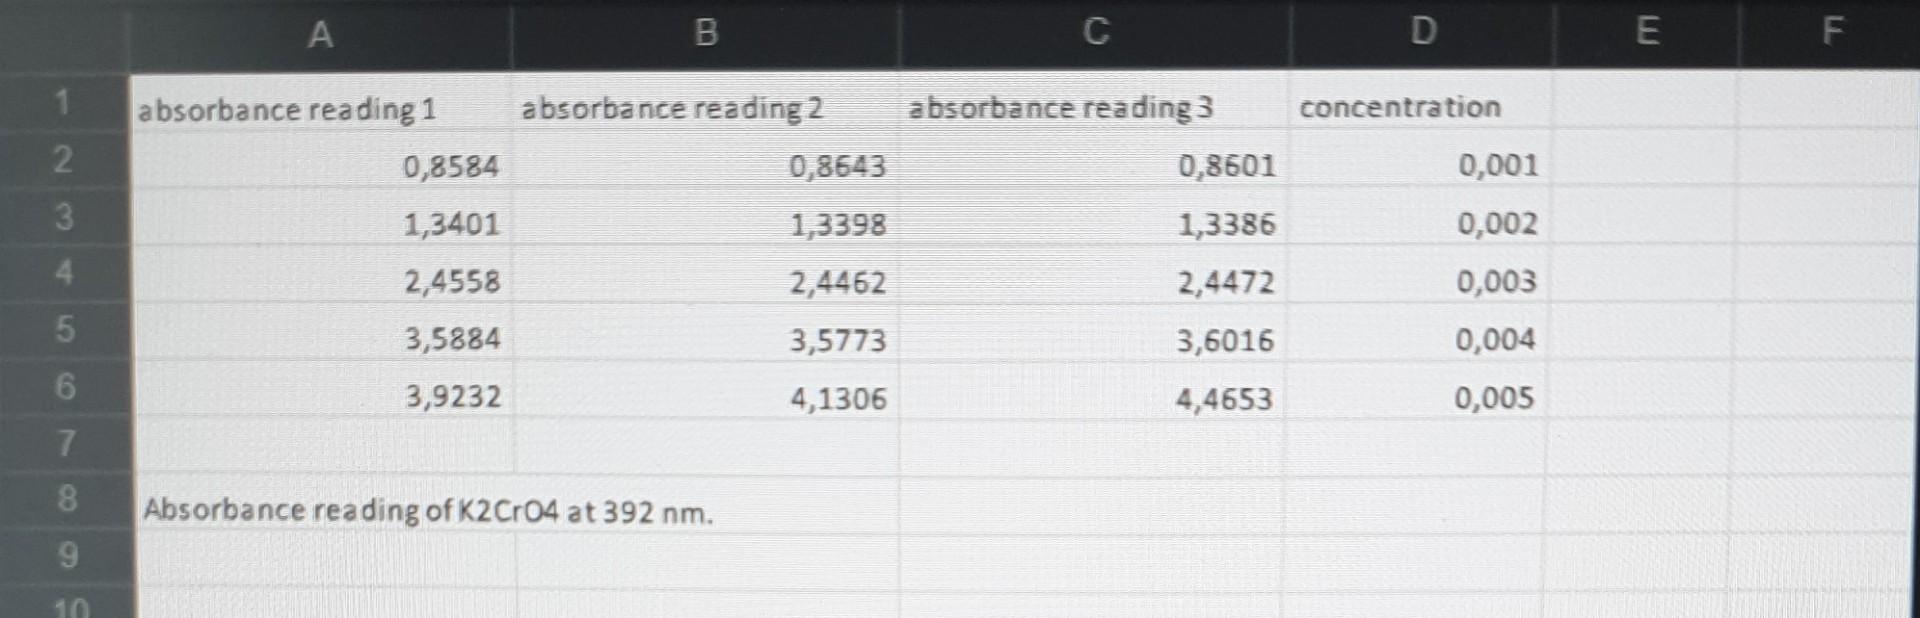
by using this data calculate the mean and std deviation of absorbance readings(absorbance reading 1,2,3) and draw the calibration curve using concentration of standards and corresponding mean of absorbance data.please explain how to draw the calibration curve on excel
Absorbance rea ding of K2CrO4 at 392nm
Step by Step Solution
There are 3 Steps involved in it
1 Expert Approved Answer
Step: 1 Unlock

Question Has Been Solved by an Expert!
Get step-by-step solutions from verified subject matter experts
Step: 2 Unlock
Step: 3 Unlock