

Question: C 0 H 1 Below (in column A) are the income per capita for a sample of 50 different households 2 Use Excel to
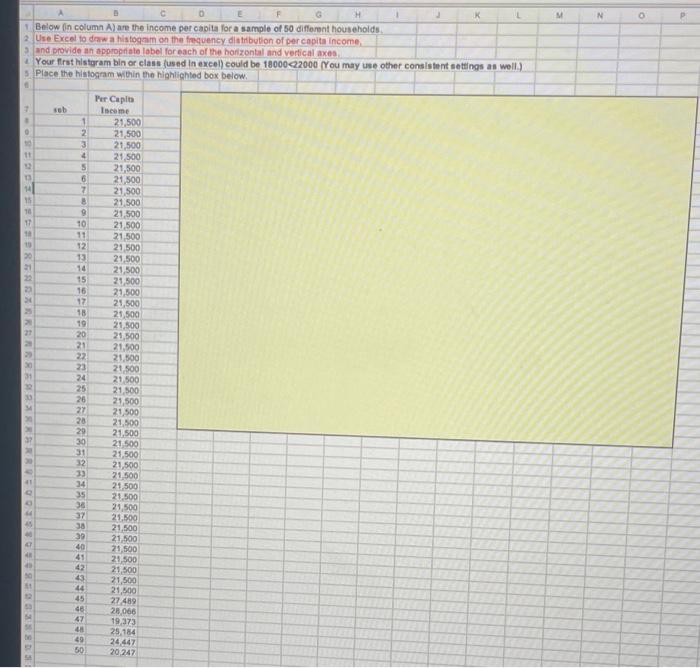
C 0 H 1 Below (in column A) are the income per capita for a sample of 50 different households 2 Use Excel to draw a histogram on the frequency distribution of per capita income, 3 and provide an appropriate label for each of the horizontal and vertical axes, Your first histgram bin or class (used in excel) could be 18000
Step by Step Solution
★★★★★
3.44 Rating (160 Votes )
There are 3 Steps involved in it
1 Expert Approved Answer
Step: 1 Unlock

Question Has Been Solved by an Expert!
Get step-by-step solutions from verified subject matter experts
Step: 2 Unlock
Step: 3 Unlock