

Question: ( c ) ( 1 0 pts ) The dendrogram of a hierarchical clustering method shows the data points in the x axis with the
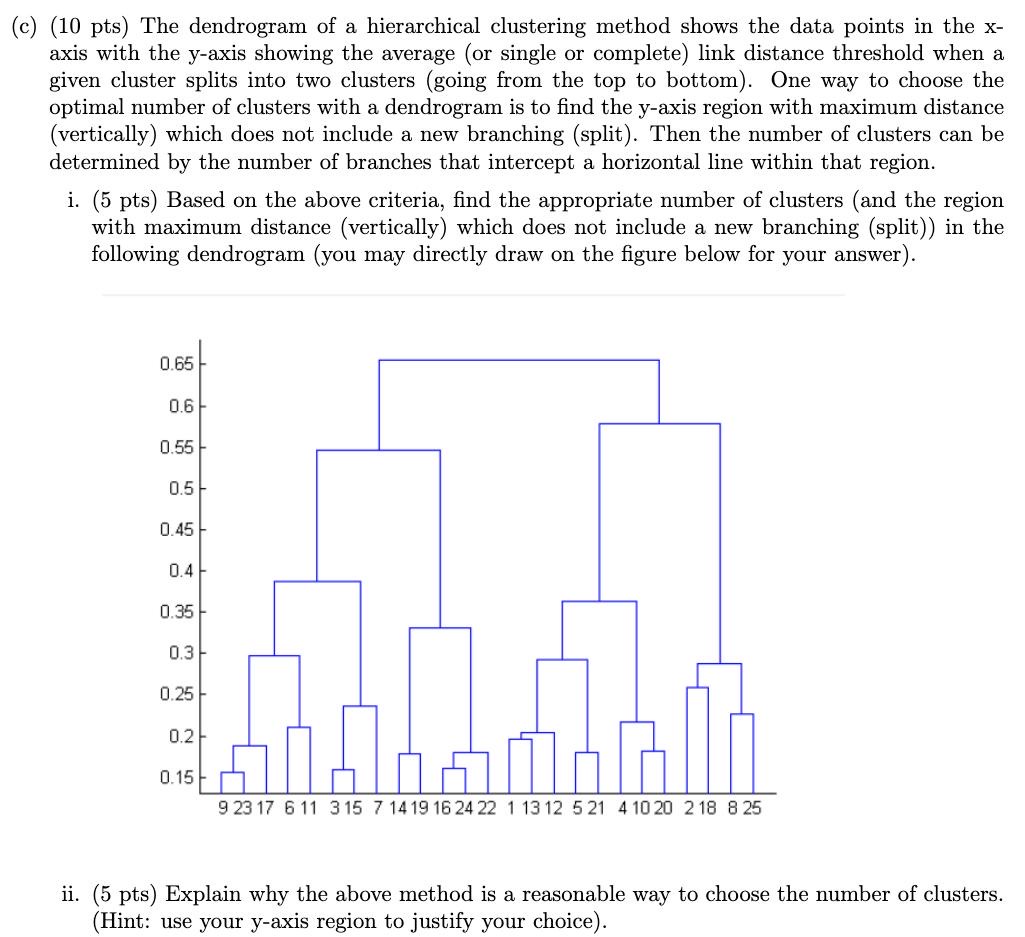
c pts The dendrogram of a hierarchical clustering method shows the data points in the x axis with the yaxis showing the average or single or complete link distance threshold when a given cluster splits into two clusters going from the top to bottom One way to choose the optimal number of clusters with a dendrogram is to find the y axis region with maximum distance vertically which does not include a new branching split Then the number of clusters can be determined by the number of branches that intercept a horizontal line within that region.
i pts Based on the above criteria, find the appropriate number of clusters and the region with maximum distance vertically which does not include a new branching split in the following dendrogram you may directly draw on the figure below for your answer
ii pts Explain why the above method is a reasonable way to choose the number of clusters. Hint: use your yaxis region to justify your choice
Step by Step Solution
There are 3 Steps involved in it
1 Expert Approved Answer
Step: 1 Unlock

Question Has Been Solved by an Expert!
Get step-by-step solutions from verified subject matter experts
Step: 2 Unlock
Step: 3 Unlock