

Question: C. 1. The graph below represents the value of Lucas' investments, which average 8% annual returns. 5000 account bala -4500 -4000 3500 3000 2500
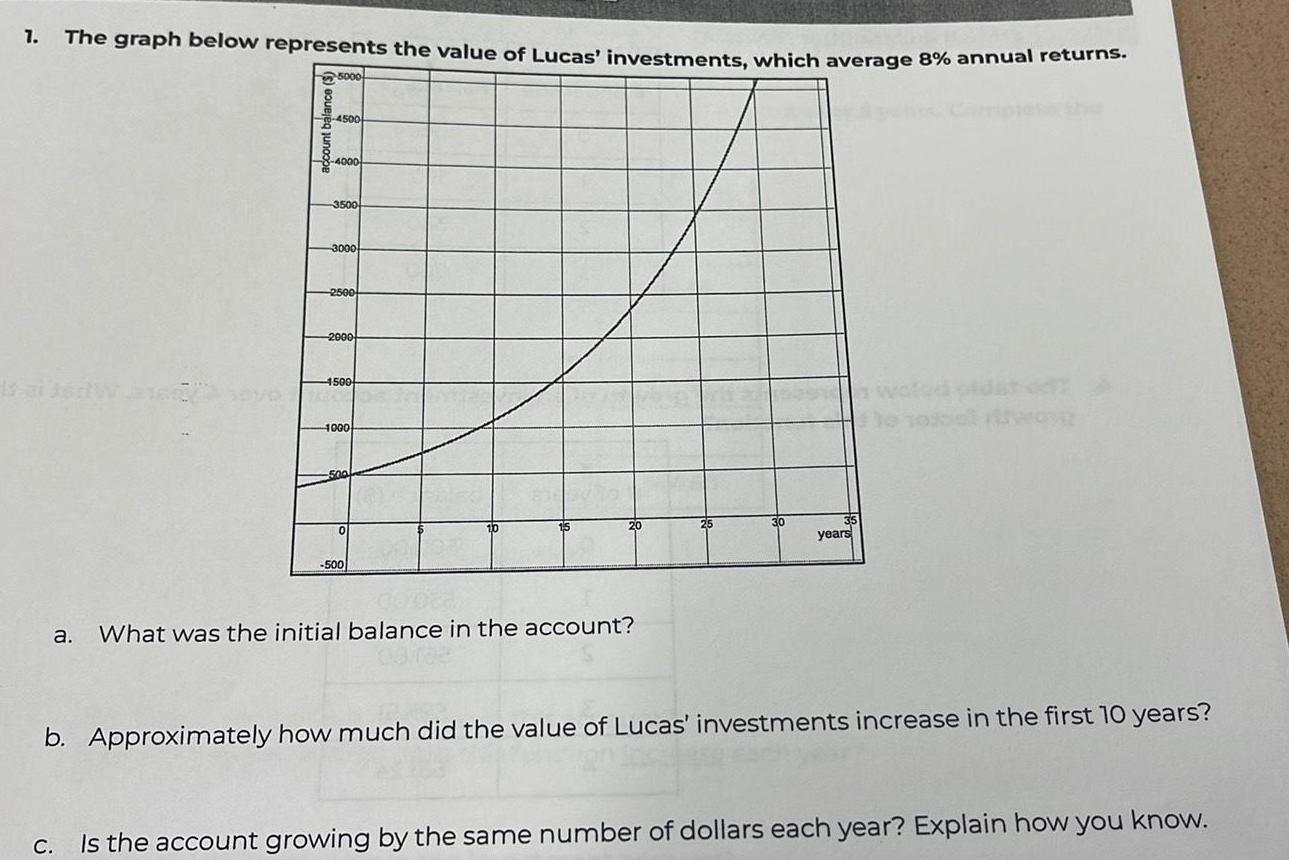
C. 1. The graph below represents the value of Lucas' investments, which average 8% annual returns. 5000 account bala -4500 -4000 3500 3000 2500 -2000 1500 1000 -500 -500 a. What was the initial balance in the account? 25 years oldat od b. Approximately how much did the value of Lucas' investments increase in the first 10 years? Is the account growing by the same number of dollars each year? Explain how you know.
Step by Step Solution
There are 3 Steps involved in it
1 Expert Approved Answer
Step: 1 Unlock

Question Has Been Solved by an Expert!
Get step-by-step solutions from verified subject matter experts
Step: 2 Unlock
Step: 3 Unlock