

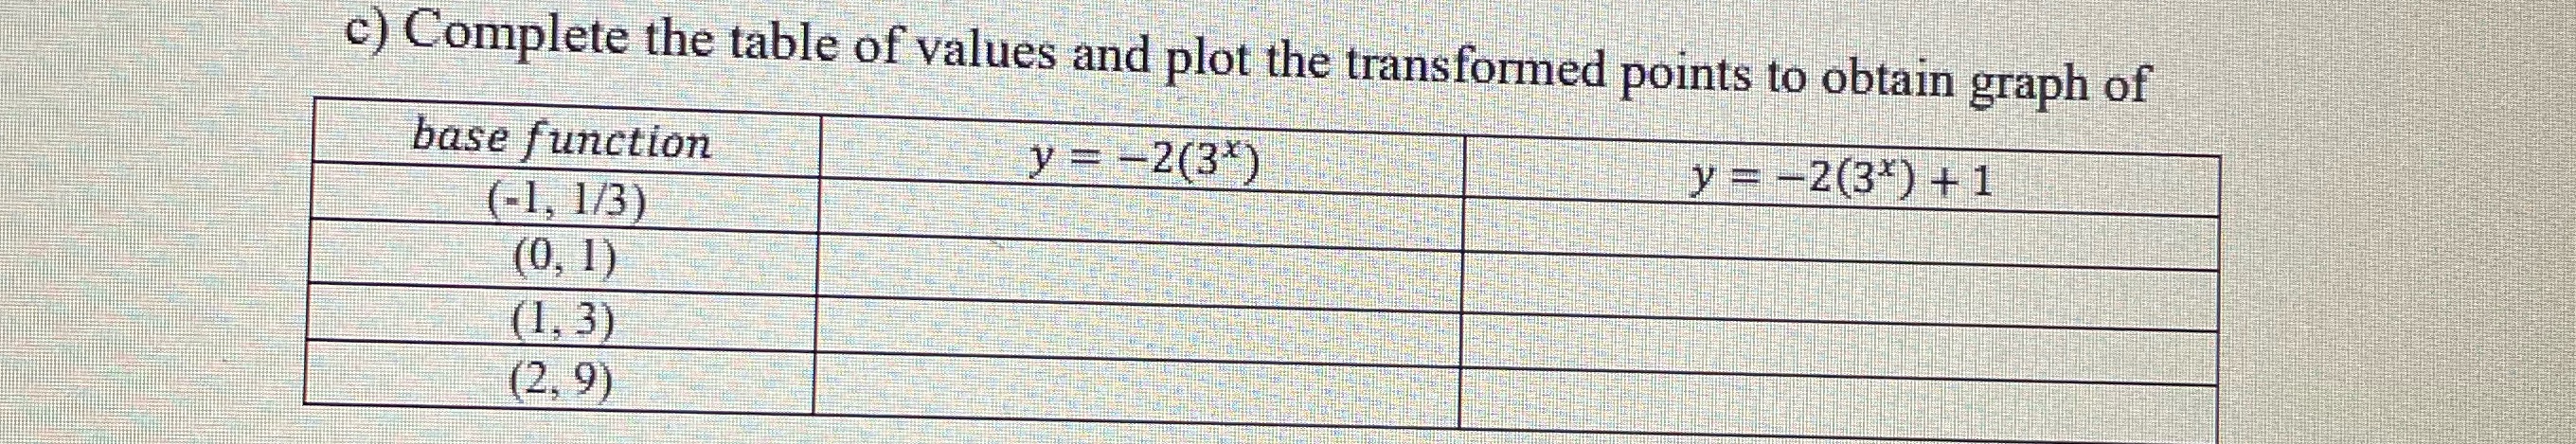
Question: c) Complete the table of values and plot the transformed points to obtain graph of base function y = -2(3%) (-1, 1/3) y = -2(3%)
Step by Step Solution
There are 3 Steps involved in it
1 Expert Approved Answer
Step: 1 Unlock

Question Has Been Solved by an Expert!
Get step-by-step solutions from verified subject matter experts
Step: 2 Unlock
Step: 3 Unlock