

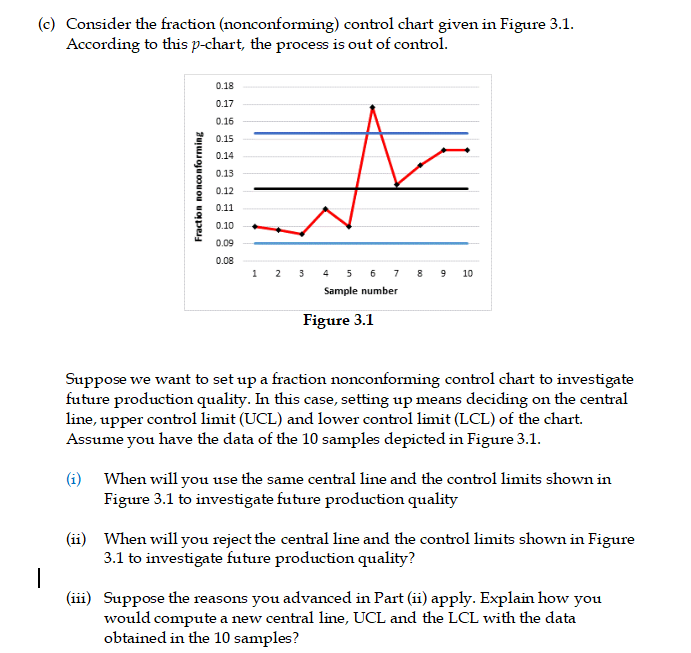
Question: (c) Consider the fraction (nonconforming) control chart given in Figure 3.1. According to this p-chart, the process is out of control. 0.18 0.17 0.16 0.15
Step by Step Solution
There are 3 Steps involved in it
1 Expert Approved Answer
Step: 1 Unlock

Question Has Been Solved by an Expert!
Get step-by-step solutions from verified subject matter experts
Step: 2 Unlock
Step: 3 Unlock