

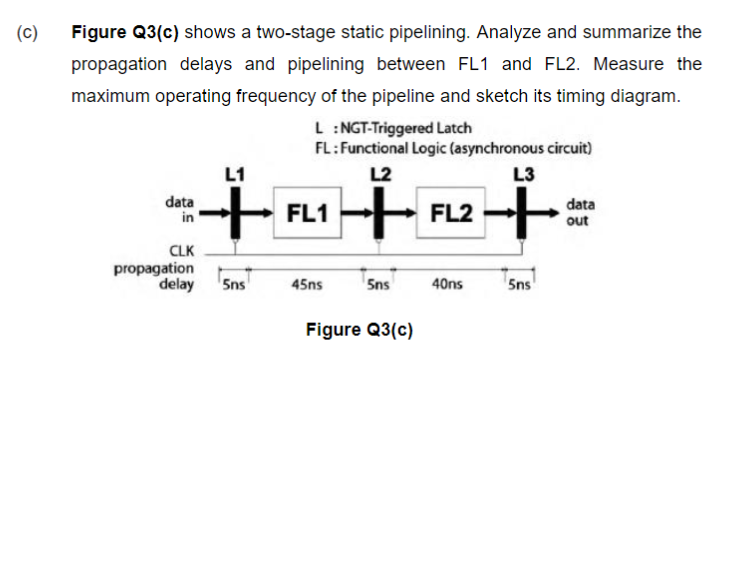
Question: ( c ) Figure Q 3 ( c ) shows a two - stage static pipelining. Analyze and summarize the propagation delays and pipelining between
c Figure Qc shows a twostage static pipelining. Analyze and summarize the propagation delays and pipelining between FL and FL Measure the maximum operating frequency of the pipeline and sketch its timing diagram.
: :NGTTriggered Latch
Step by Step Solution
There are 3 Steps involved in it
1 Expert Approved Answer
Step: 1 Unlock

Question Has Been Solved by an Expert!
Get step-by-step solutions from verified subject matter experts
Step: 2 Unlock
Step: 3 Unlock