

Question: c. Find or estimate the P-value. d. Based on your answers for parts (a) through (c), will you reject or fail to reject the null
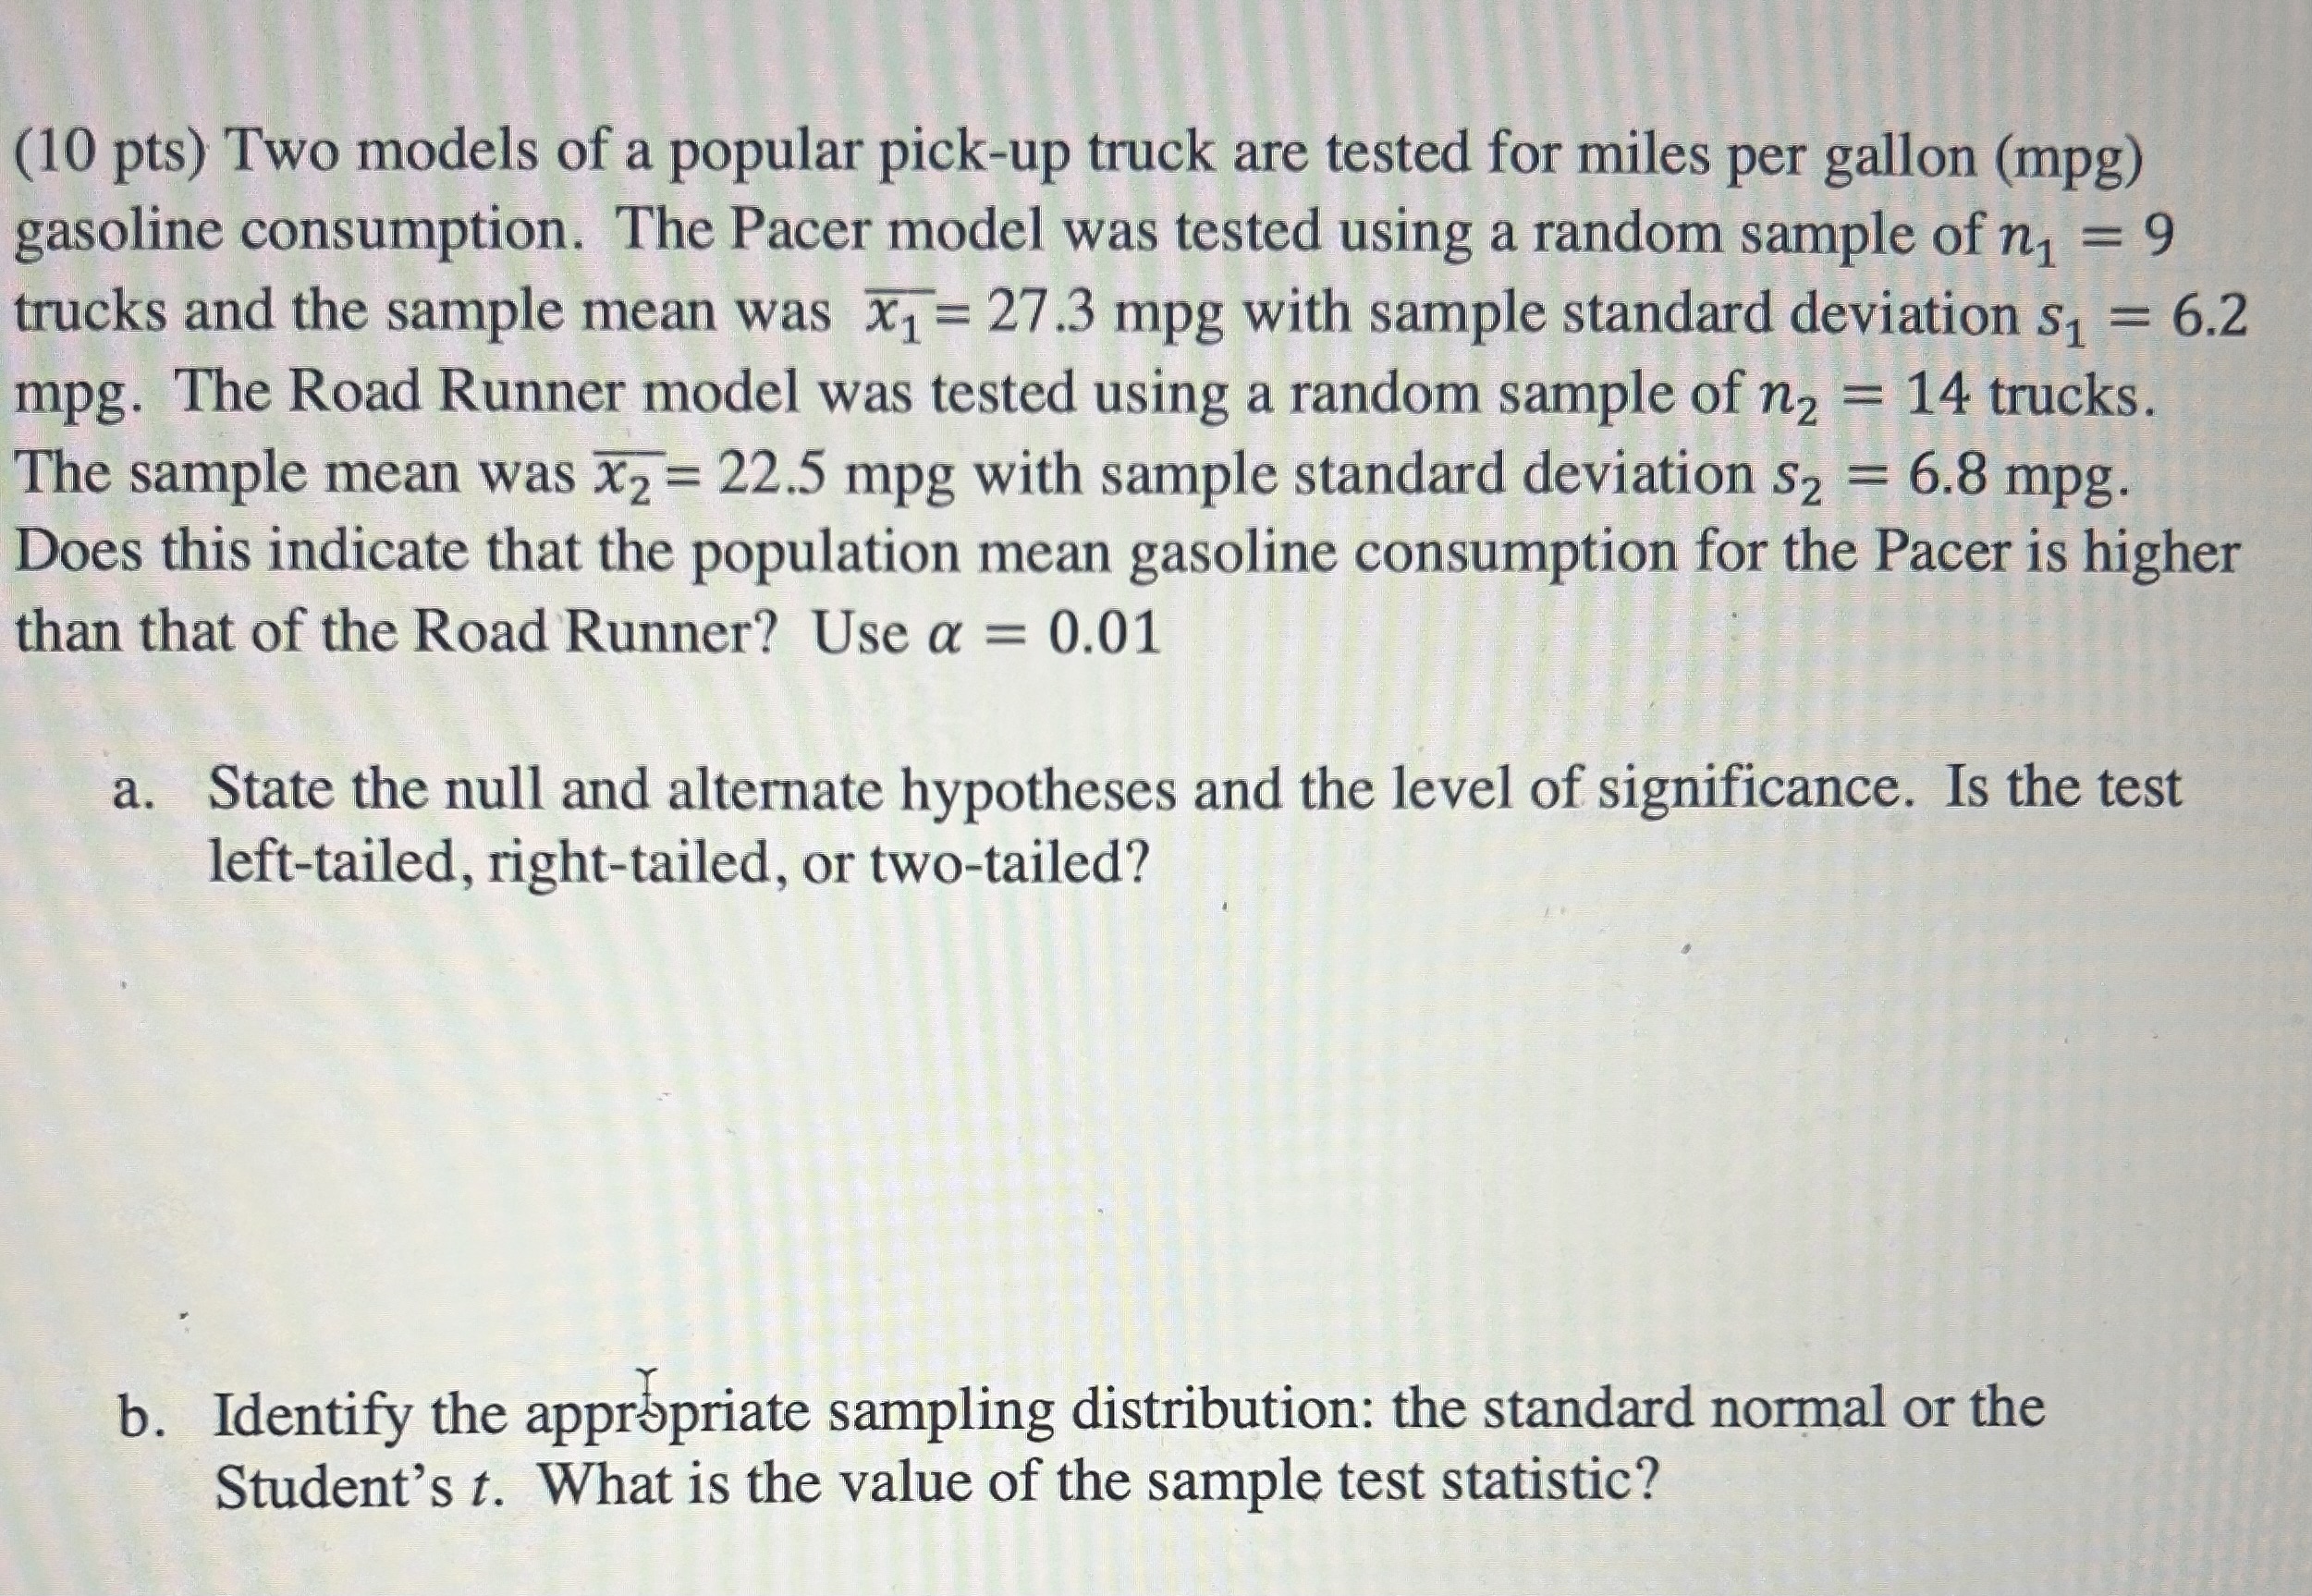
c. Find or estimate the P-value. d. Based on your answers for parts (a) through (c), will you reject or fail to reject the null hypothesis?(10 pts) Two models of a popular pick-up truck are tested for miles per gallon (mpg) gasoline consumption. The Pacer model was tested using a random sample of n, = 9 trucks and the sample mean was x1 = 27.3 mpg with sample standard deviation S, = 6.2 mpg. The Road Runner model was tested using a random sample of n2 = 14 trucks. The sample mean was x2 = 22.5 mpg with sample standard deviation $2 = 6.8 mpg. Does this indicate that the population mean gasoline consumption for the Pacer is higher than that of the Road Runner? Use a = 0.01 a. State the null and alternate hypotheses and the level of significance. Is the test left-tailed, right-tailed, or two-tailed? b. Identify the appropriate sampling distribution: the standard normal or the Student's t. What is the value of the sample test statistic
Step by Step Solution
There are 3 Steps involved in it

Get step-by-step solutions from verified subject matter experts