

Question: C. Given the following Treasury bond yield information, construct a graph of the yield curve. Maturity Yield 5.27% 1 year 2 years 5.37 5.52 3
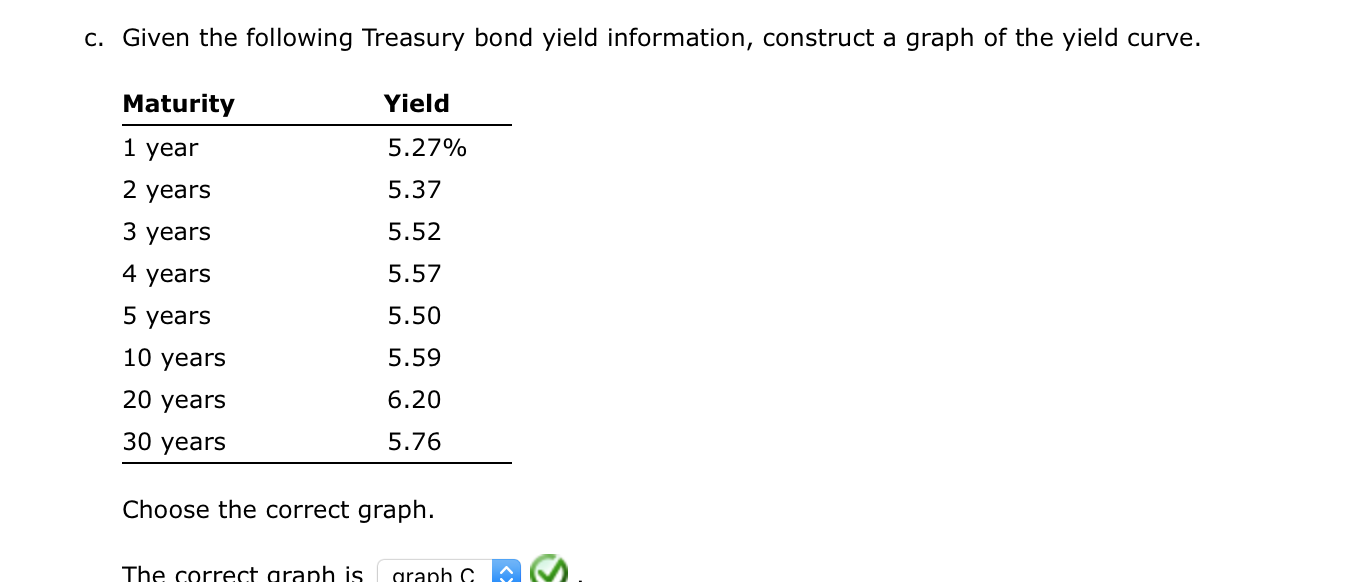
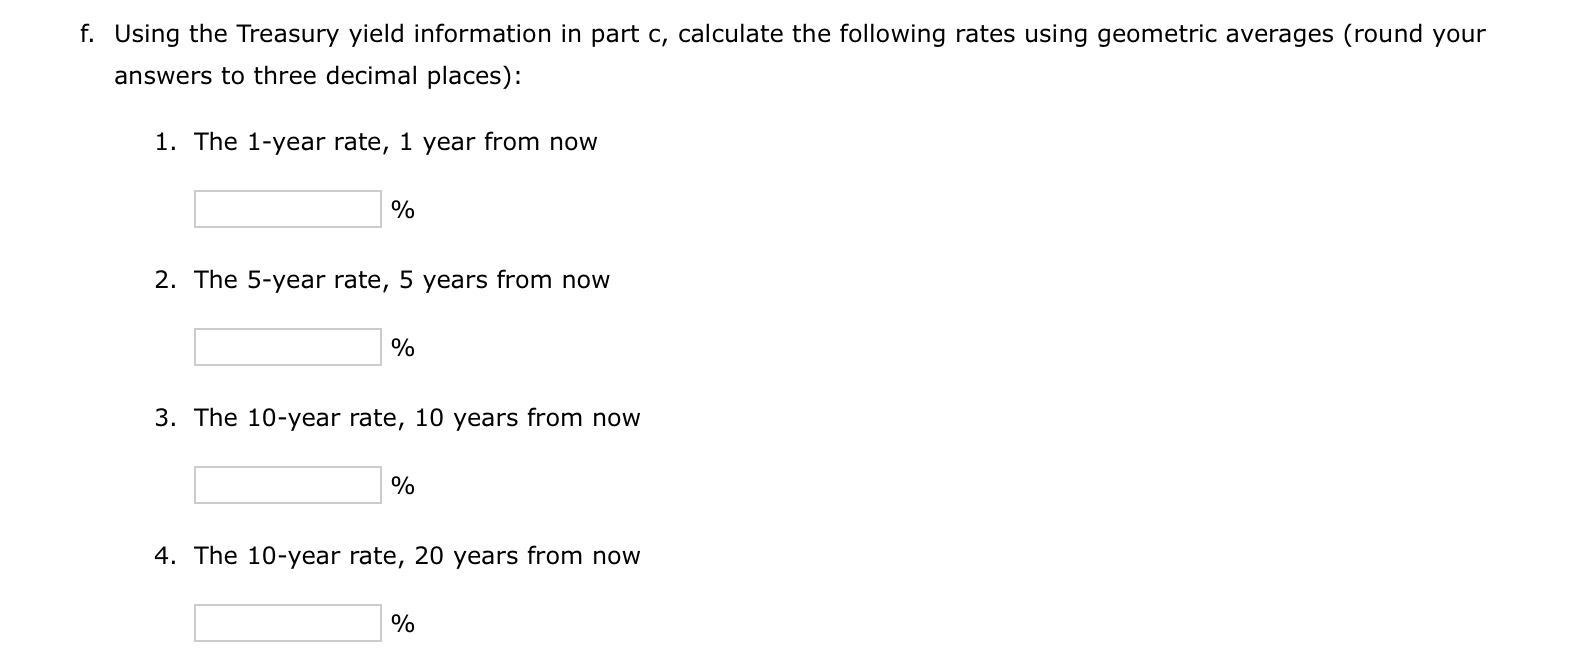
C. Given the following Treasury bond yield information, construct a graph of the yield curve. Maturity Yield 5.27% 1 year 2 years 5.37 5.52 3 years 4 years 5.57 5 years 5.50 10 years 5.59 20 years 6.20 30 years 5.76 Choose the correct graph. The correct graph is graph f. Using the Treasury yield information in part c, calculate the following rates using geometric averages (round your answers to three decimal places): 1. The 1-year rate, 1 year from now % 2. The 5-year rate, 5 years from now % 3. The 10-year rate, 10 years from now % 4. The 10-year rate, 20 years from now %
Step by Step Solution
There are 3 Steps involved in it
1 Expert Approved Answer
Step: 1 Unlock

Question Has Been Solved by an Expert!
Get step-by-step solutions from verified subject matter experts
Step: 2 Unlock
Step: 3 Unlock