

Question: c . Graph the Lorenz curves L ( x ) = x p corresponding to p = 1 3 , 1 . 6 , 2
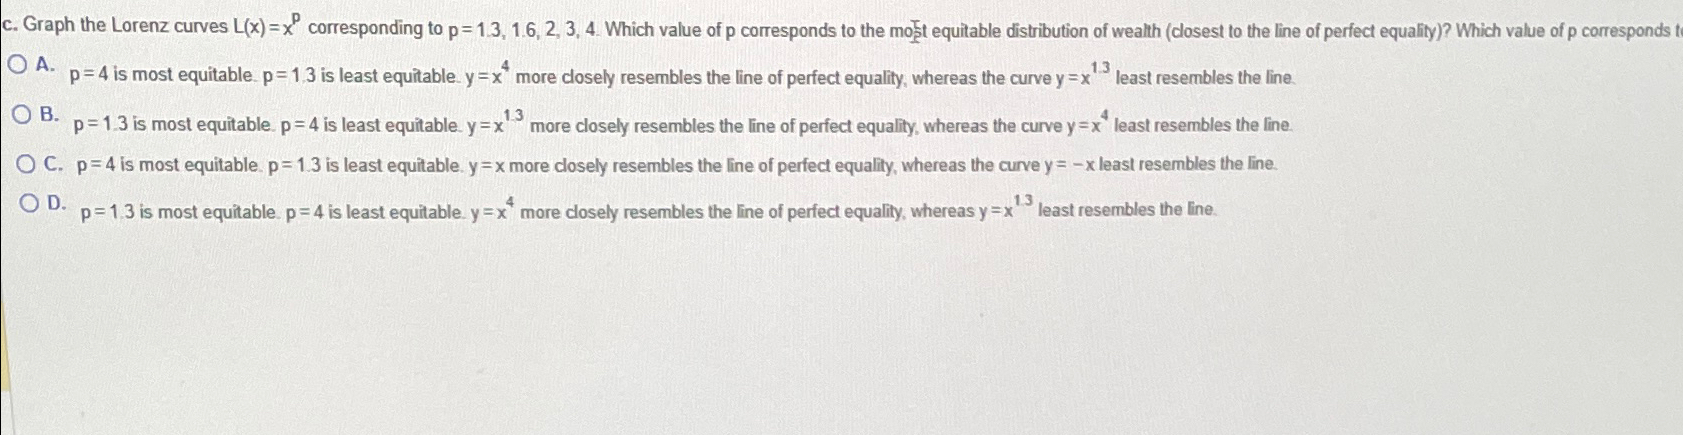
c Graph the Lorenz curves corresponding to Which value of corresponds to the most equitable distribution of wealth closest to the line of perfect equality Which value of corresponds
A is most equitable. is least equitable. more closely resembles the line of perfect equality, whereas the curve least resembles the line.
B is most equitable. is least equitable. more closely resembles the line of perfect equality, whereas the curve least resembles the line.
C is most equitable. is least equitable. more closely resembles the line of perfect equality, whereas the curve least resembles the line.
D is most equitable. is least equitable. more closely resembles the line of perfect equality, whereas least resembles the line.
Step by Step Solution
There are 3 Steps involved in it
1 Expert Approved Answer
Step: 1 Unlock

Question Has Been Solved by an Expert!
Get step-by-step solutions from verified subject matter experts
Step: 2 Unlock
Step: 3 Unlock