

Question: c# I have created a simple code that reads in data from a csv file then transfers that data to a datatable. the datatable is
c#
I have created a simple code that reads in data from a csv file then transfers that data to a datatable. the datatable is displayed on a datagridview. I would like to display two columns from my datable to a line chart. the application works but no chart appears. What am i doing wrong.
namespace WindowsFormsApp6 { public partial class Form1 : Form { public static class Construct { public static DataTable MainDataTable = new DataTable(); public static List fileDirectories = new List(); public static List pathList = new List(); } public class datalist { public decimal DataLimit { get; set; } public DateTime Date1 { get; set; } } public Form1() { InitializeComponent(); } private void button1_Click(object sender, EventArgs e) { Construct.MainDataTable.Dispose(); Construct.MainDataTable.Columns.Clear(); Construct.MainDataTable.Rows.Clear(); Construct.fileDirectories.Clear(); chart1.Series.Clear(); chart1.ChartAreas.Clear(); GC.Collect(); string earliestdate = dateTimePicker1.Value.ToString("yyyy-MM-dd"); string latestdate = dateTimePicker2.Value.ToString("yyyy-MM-dd"); DateTime EarlyTime = dateTimePicker1.Value.Date; DateTime LateTime = dateTimePicker2.Value.Date; List fileDirectories = new List(); if (1 == 1) { fileDirectories.Add(@"C:\Users\99\Downloads\x"); } foreach (string selectedPath in fileDirectories) { string[] level1 = Directory.GetFiles(@selectedPath, "*.csv", SearchOption.AllDirectories); foreach (string level2 in level1) { DateTime lastModDate = File.GetLastWriteTime(@level2); if (lastModDate >= Convert.ToDateTime(earliestdate) && lastModDate = 0) { DataRow allShiftRow = Construct.MainDataTable.NewRow(); Data = line.Split(',')[12]; testNo = line.Split(',')[3]; Upplimit = line.Split(',')[8]; LowLimit = line.Split(',')[10]; allShiftRow["Date"] = date; allShiftRow["Time"] = time; allShiftRow["TestNo"] = testNo; allShiftRow["Upper Limit"] = Upplimit; allShiftRow["Lower Limit"] = LowLimit; allShiftRow["Data"] = Data; Construct.MainDataTable.Rows.Add(allShiftRow); dataGridView1.DataSource = Construct.MainDataTable; List 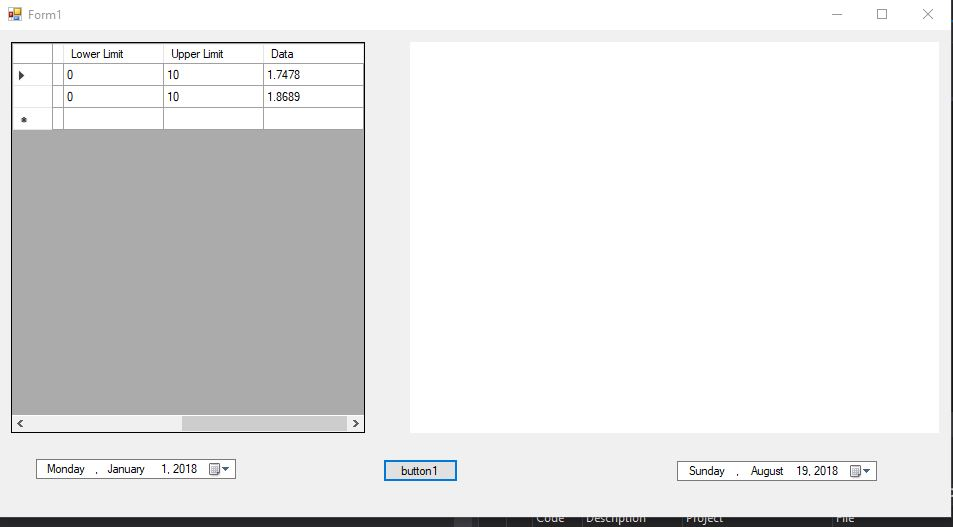
Form Upper Limit 10 10 Lower Limit Data 1.7478 1.8689 Monday January 1, 2018 button 1 Sunday . August 19, 2013
Step by Step Solution
There are 3 Steps involved in it
1 Expert Approved Answer
Step: 1 Unlock

Question Has Been Solved by an Expert!
Get step-by-step solutions from verified subject matter experts
Step: 2 Unlock
Step: 3 Unlock