

Question: c. If warranted, use the Tukey-Kramer procedure for multiple comparisons to determine which populations have different means. (Assume a = 0.05) Comparison Significant Difference Sample
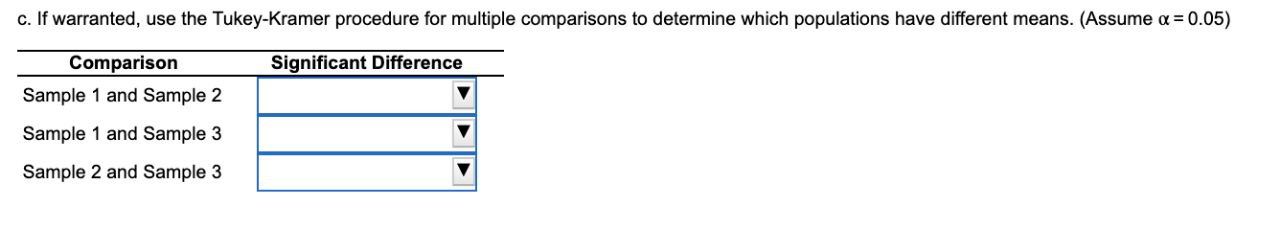
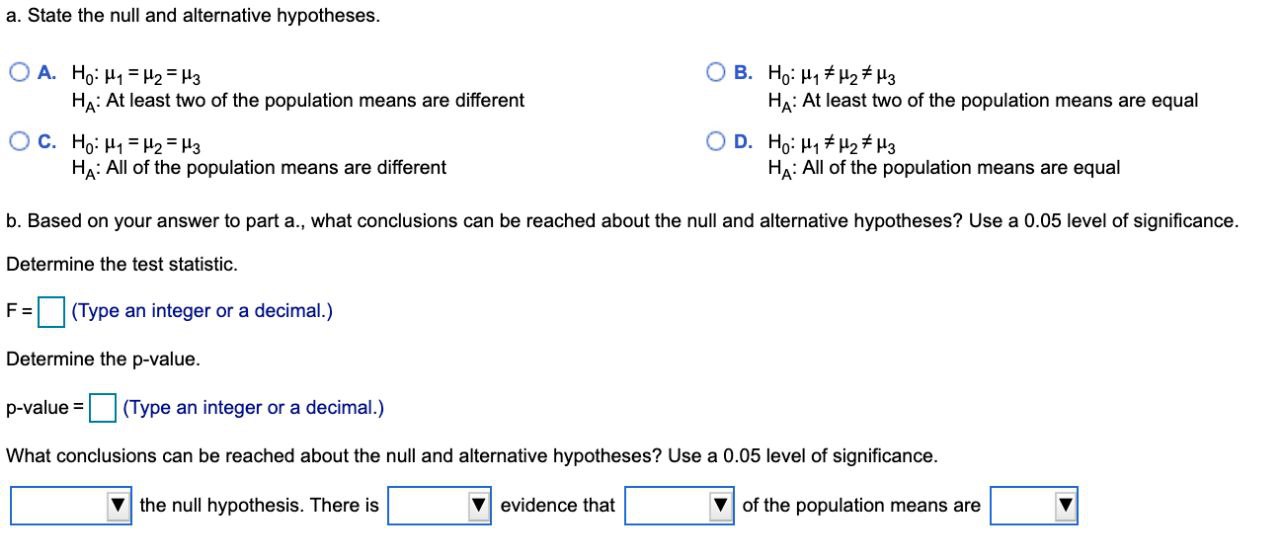

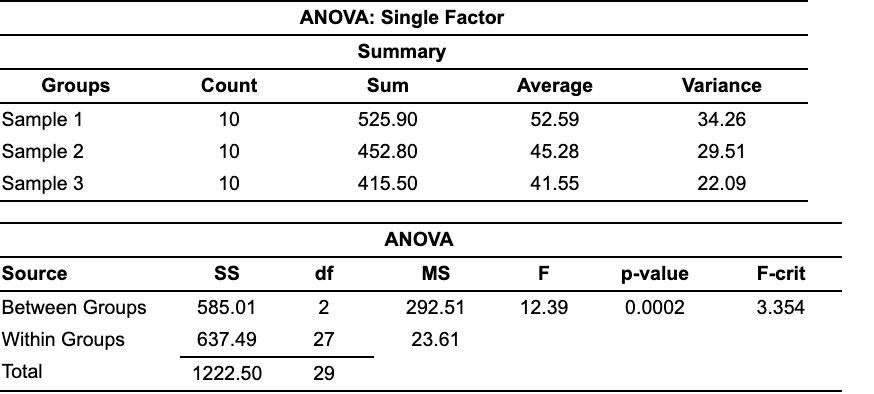
c. If warranted, use the Tukey-Kramer procedure for multiple comparisons to determine which populations have different means. (Assume a = 0.05) Comparison Significant Difference Sample 1 and Sample 2 Sample 1 and Sample 3 Sample 2 and Sample 3a. State the null and alternative hypotheses. OA. Ho: H1 = H2= H3 OB. Ho: H1 # H2 # 13 HA: At least two of the population means are different HA: At least two of the population means are equal OC. Ho: Hy = H2= H3 OD. Ho: Hy # H2 # H3 HA: All of the population means are different HA: All of the population means are equal b. Based on your answer to part a., what conclusions can be reached about the null and alternative hypotheses? Use a 0.05 level of significance. Determine the test statistic. F = (Type an integer or a decimal.) Determine the p-value. p-value = (Type an integer or a decimal.) What conclusions can be reached about the null and alternative hypotheses? Use a 0.05 level of significance. the null hypothesis. There is evidence that of the population means areAmanager is interested in testing whether three populations of interest have equal population means. Simple random samples of size 10 were selected from each population. The ANOVAtable and related statistics were computed and are linked below. Complete parts a through c below. 0 Click the icon to view the ANOVA table and related statistics. 3 Click the icon to View a table of q-values. ANOVA: Single Factor Summary Groups Count Sum Average Variance Sample 1 10 525.90 52.59 34.26 Sample 2 10 452.80 45.28 29.51 Sample 3 10 415.50 41.55 22.09 ANOVA Source SS df MS F p-value F-crit Between Groups 585.01 2 292.51 12.39 0.0002 3.354 Within Groups 637.49 27 23.61 Total 1222.50 29
Step by Step Solution
There are 3 Steps involved in it

Get step-by-step solutions from verified subject matter experts