

Question: C++ loop Program The CPlusPlus & LandMinusMinus company needs you to write a program which will produce a report, in both numbers and chart form,
C++ loop Program
The CPlusPlus & LandMinusMinus company needs you to write a program which will produce a report, in both numbers and chart form, showing how their three divisions are doing, for any given month, in generating net sales.
The corporate tax rate for the company is 30% and the three divisions are East Coast, Mid West, and West Coast (define as constants).
Repeatedly:
Have the user enter a month name, and then process each division, one at a time:
Have the user enter the sales amount and expense amount for the division, using the division name as a prompt. Each sales and expense amount must be zero or greater.
Calculate the net sales amount for the division (sales less expense, less tax on sales minus expense).
After the three divisions are processed, display a Net Sales report which displays, for each division:
-a line showing the division name and its net sales, followed by an asterisk (*) for each $1,000 in net sales (i.e., if a division had $3,700 in net sales, 3 asterisks would be displayed). If a divisions net sales were less than $1,000, display a single hyphen instead of any asterisks (hint: use a loop to display the asterisks).
Then process the next month name, or end the loop (unknown number of months).
After all months are processed, display the average sales for a month, and the name of the month and its net sales amount for the month with the highest net sales.
Use this data for the screen print:
March (division: sales, expense)
East Coast: $15,000, $1,500
Mid West: $20,000, $1,000
West Coast: $18,500, $2,000
August (division: sales, expense)
East Coast: $25,000, $5,500
Mid West: $17,000, $1,000
West Coast: $14,500, $13,100
Below is an example of how the report might look (you must show the input as well):
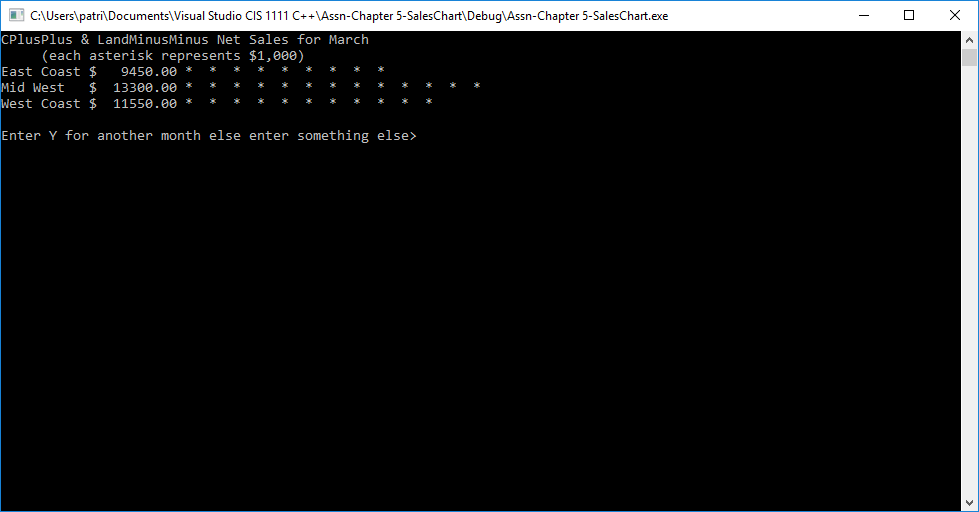
CAUsers patrilDocuments Visual Studio CIS 1111 C+Assn-Chapter 5-SalesChart DebuglAssn-Chapter 5-SalesChart.exe CPlusPlus & LandMinusMinus Net Sales for March (each asterisk represents $1,000) East Coast$ 9450.0 Mid West 13300.00 est Coast 11550.00 Enter Y for another month else enter something else>
Step by Step Solution
There are 3 Steps involved in it

Get step-by-step solutions from verified subject matter experts