

Question: c Messages for Analysis point 9.15. Message 9.A: Presenting Data (Bar Charts) 0.1) LO-3) Examine the bar chart in Figure 9.18 and 9.16. Message 9.B:
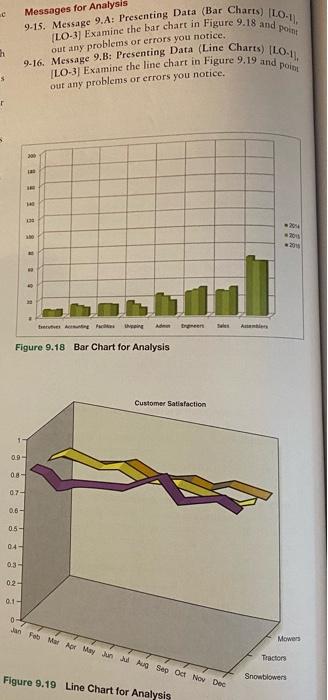
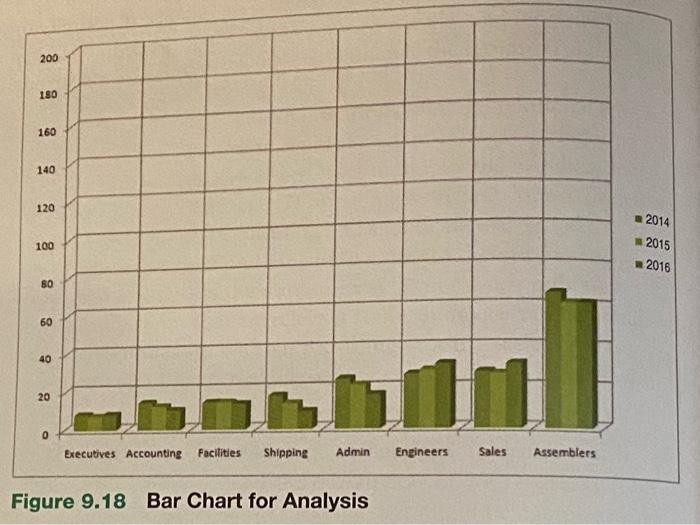
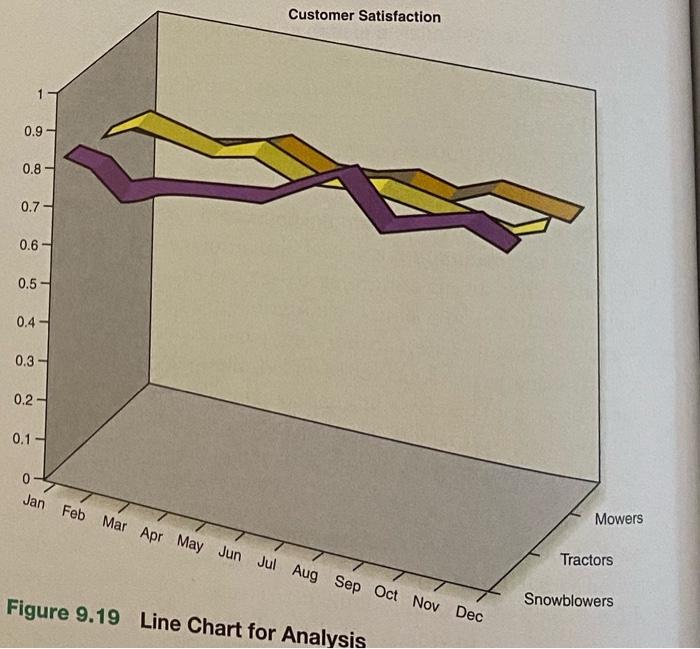
c Messages for Analysis point 9.15. Message 9.A: Presenting Data (Bar Charts) 0.1) LO-3) Examine the bar chart in Figure 9.18 and 9.16. Message 9.B: Presenting Data (Line Charts) 110-11 LO-3) Examine the line chart in Figure 9.19 and poin out any problems or errors you notice. 1 3 out any problems or errors you notice. 1 - 2014 2018 20 th Drgreen Figure 9.18 Bar Chart for Analysis Customer Satisfaction 0.9 08- 07 0.6 05- 04- 03- 02- 0.1- 0 Feb Mar Apr May Jun Aug Sep Oct Nov Dec Mowers Tractors Snowblowers Figure 9.19 Line Chart for Analysis 200 180 160 140 120 100 2014 2015 2016 80 60 40 20 0 Executives Accounting Facilities Shipping Admin Engineers Sales Assemblers Figure 9.18 Bar Chart for Analysis Customer Satisfaction 0.9 0.8 - 0.7 0.6 0.5 0.4 0.3 0.2 0.1 0 Jan Feb Mar Apr May Jun Jul Aug Sep Oct Nov Dec Mowers Tractors Figure 9.19 Line Chart for Analysis Snowblowers
Step by Step Solution
There are 3 Steps involved in it

Get step-by-step solutions from verified subject matter experts