

Question: C. operator to select that specific variable). You do not have to save this plot, but I will be able to tell by your code
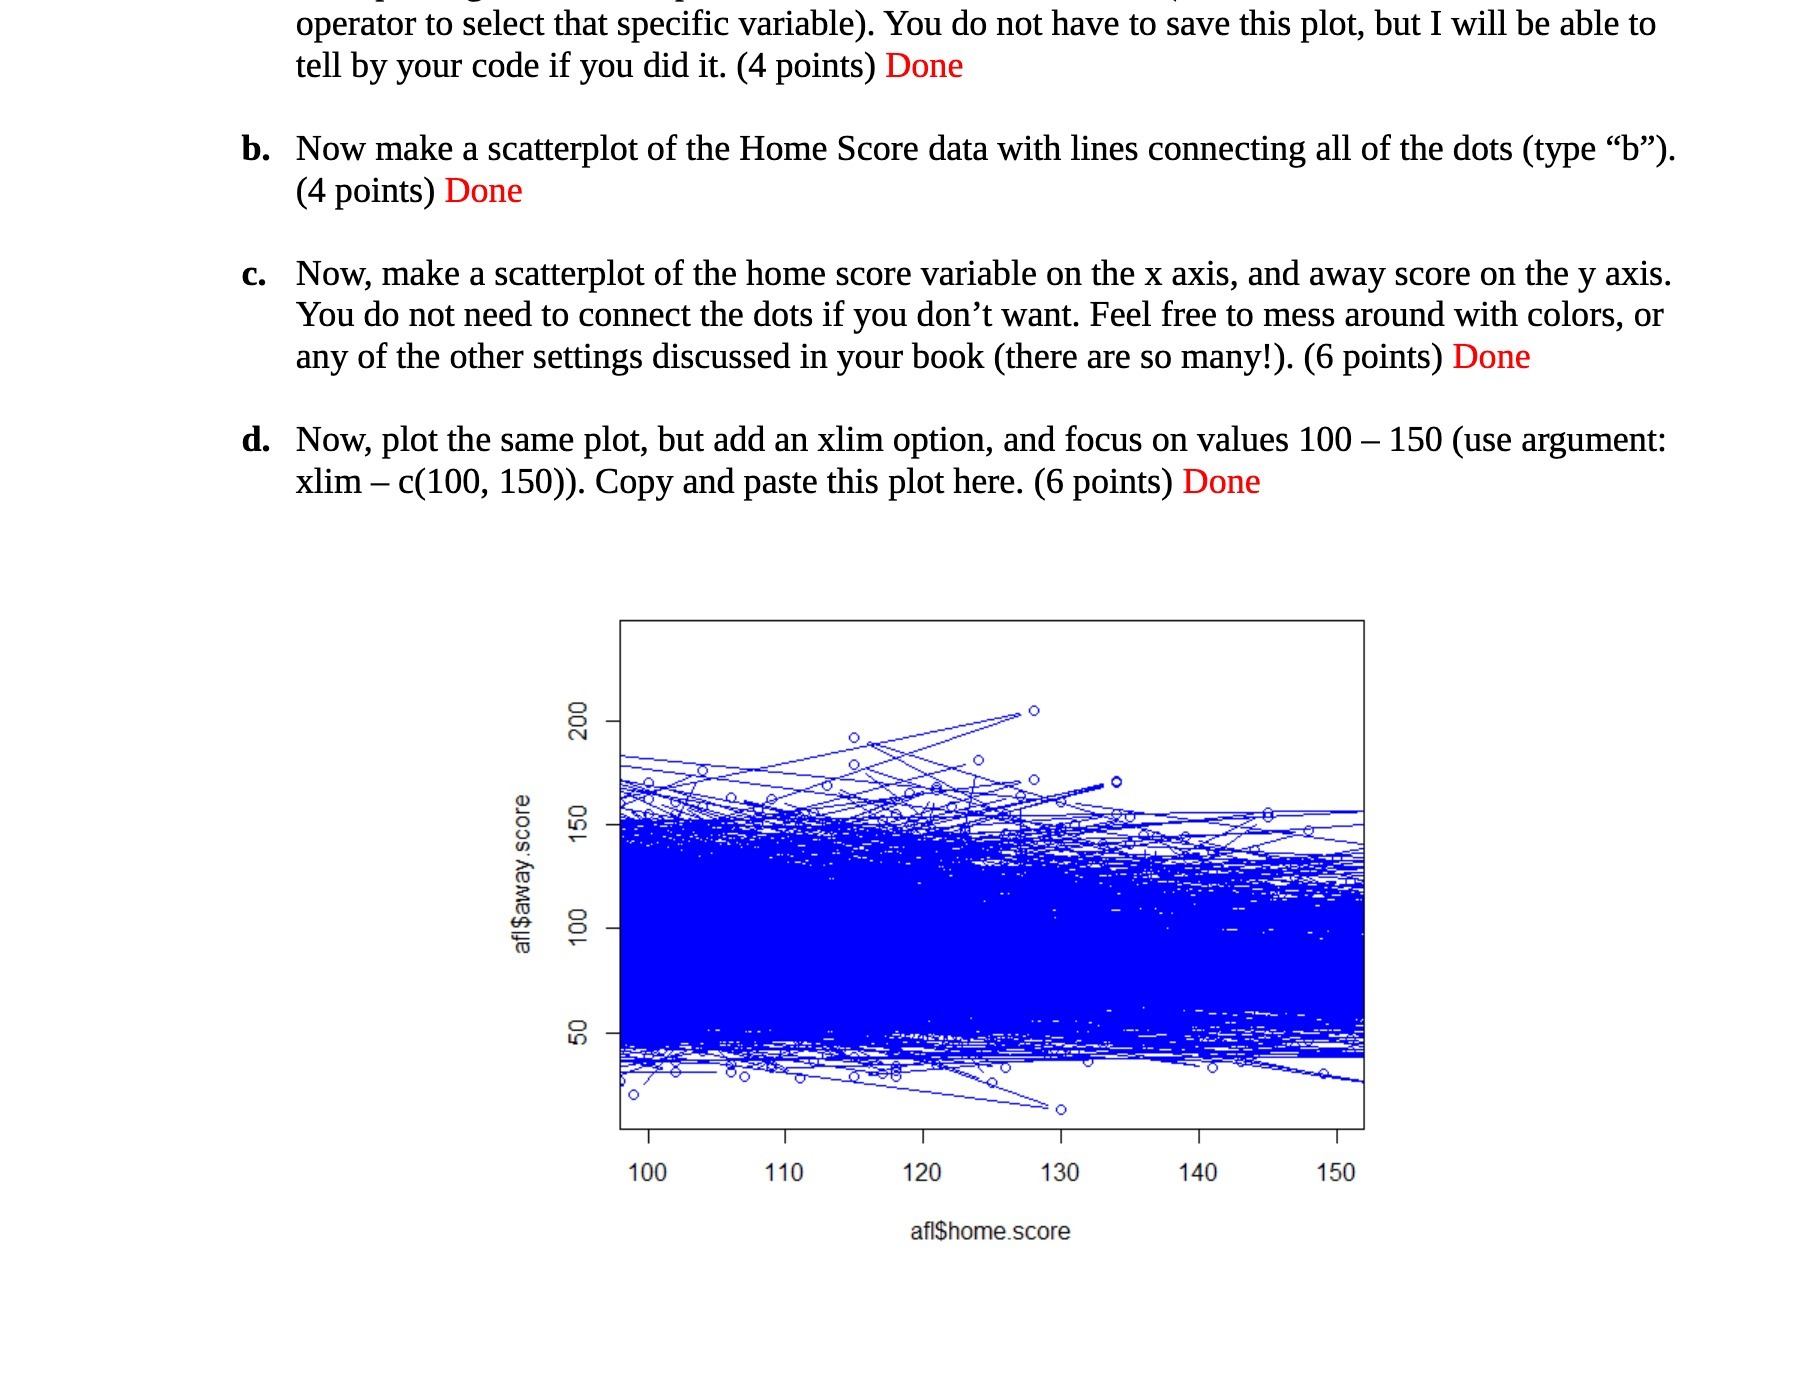
C. operator to select that specific variable). You do not have to save this plot, but I will be able to tell by your code if you did it. (4 points) Done Now make a scatterplot of the Home Score data with lines connecting all of the dots (type \"b\"). (4 points) Done Now, make a scatterplot of the home score variable on the x axis, and away score on the y axis. You do not need to connect the dots if you don't want. Feel free to mess around with colors, or any of the other settings discussed in your book (there are so many!). (6 points) Done Now, plot the same plot, but add an xlim option, and focus on values 100 150 (use argument: xlim c(100, 150)). Copy and paste this plot here. (6 points) Done 200 150 afl$awayscore 100 50 100 110 120 130 140 150 afl$home_score
Step by Step Solution
There are 3 Steps involved in it

Get step-by-step solutions from verified subject matter experts