

Question: c sensor in a control system generates a signal with the frequency spectrum shown in Figure 7 . The signal is filtered to give the
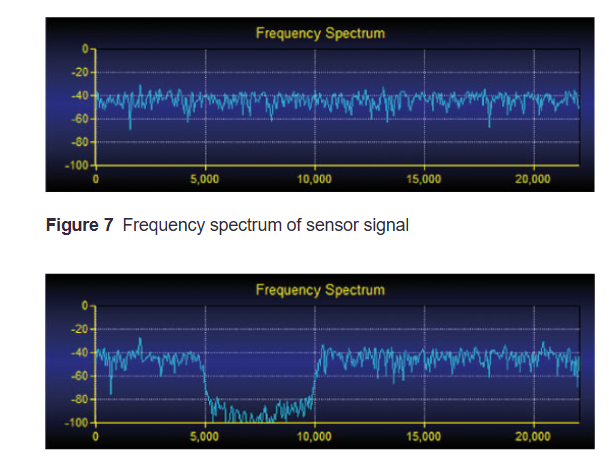
c sensor in a control system generates a signal with the frequency spectrum shown in Figure The signal is filtered to give the output shown in Figure Draw the idealised frequency response of the filter used and give estimated values of cutoff frequencies where possible. A hand drawn sketch is acceptable.
d What impact would increasing the number of taps in a digital filter design have on the width of the transition zone? What tradeoff in the filter performance might be introduced by increasing the number of taps?
Frequency Spectrum
Figure Frequency spectrum of sensor signal
iFigure shows two images of pictures from The Higgins Gallery, Bedford, UK
Briefly say what the histograms show, and state which histogram belongs to which image. Justify your answer.
iiFigure ab shows images of St Pauls Church in Bedford, UK The image in b is obtained by processing image a in VisionLab. Figure c and d show colour histograms associated with the pictures in a and b but which set of histograms goes with which image is for you to establish by answering the following.
Summarise how the distribution of blue pixels in the histogram in d differs from that in the blue histogram in c
What image processing technique is suggested by the difference the in the pixel distributions in the two blue histograms? Hence explain which set of histograms goes with image a and which with image b
fFigure a shows a banner flag made up of a cyan H letter on a white background. The histograms for the image are shown in Figure c
As shown in Figure c the threshold values are set to Tred and Tblue Let the red greyscale of a pixel be denoted by r the green greyscale be denoted by g and the blue greyscale be denoted by b
iSay what would be seen if the image were thresholded so that all pixels with r Tred g Tgreen and b Tblue become magenta. Give a screenshot to illustrate your answer.
iiSay what would be seen if the image were thresholded so that all pixels with r Tred g Tgreen and b Tblue become yellow. Give a screenshot to illustrate your answer.
iii.It is required to segment this image to recognise the letter H on the banner flag. This is to be achieved by drawing a green box around the letter H as shown in Figure bSmall green boxes outside the H in Figure b can be ignored. Say which segmentation approach you would choose. Give a screenshot to illustrate your answer.
a
b
ca
b
Green
threshold:
Intensity
Highchartsicom
threshold:
Blue
Greyscale
Fiaure Image of a banner flag and its arevscale histoarams
Step by Step Solution
There are 3 Steps involved in it
1 Expert Approved Answer
Step: 1 Unlock

Question Has Been Solved by an Expert!
Get step-by-step solutions from verified subject matter experts
Step: 2 Unlock
Step: 3 Unlock