

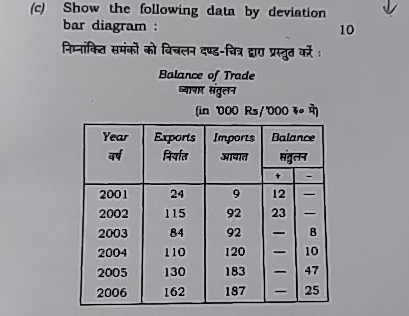
Question: ( c ) Show the following data by deviation bar diagram : 1 0 - : Balance of Trade ( in 0 0 0 R
c Show the following data by deviation bar diagram :
:
Balance of Trade
in
tabletableYeartableExporlstableImporLstableBalance
Step by Step Solution
There are 3 Steps involved in it
1 Expert Approved Answer
Step: 1 Unlock

Question Has Been Solved by an Expert!
Get step-by-step solutions from verified subject matter experts
Step: 2 Unlock
Step: 3 Unlock