

Question: c Table of Data Consider the function represented by the following data table Temp 125 120 115 Or consider the associated scatter plot graph 110
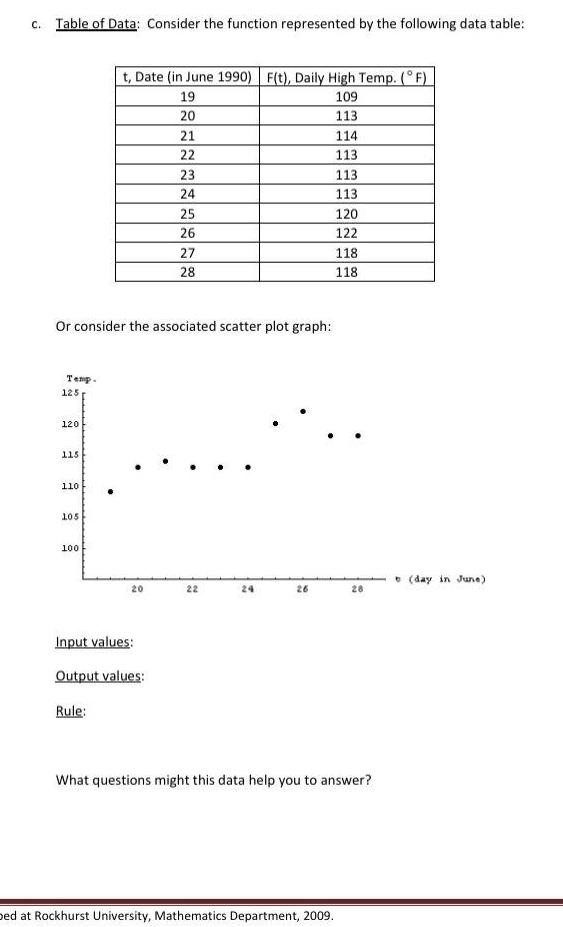

c Table of Data Consider the function represented by the following data table Temp 125 120 115 Or consider the associated scatter plot graph 110 105 100 t Date in June 1990 F t Daily High Temp F 109 113 114 113 113 113 120 122 118 118 Rule 20 Input values Output values 19 20 21 22 23 24 25 26 27 28 22 24 26 28 What questions might this data help you to answer bed at Rockhurst University Mathematics Department 2009 day in June
Step by Step Solution
There are 3 Steps involved in it
1 Expert Approved Answer
Step: 1 Unlock

Question Has Been Solved by an Expert!
Get step-by-step solutions from verified subject matter experts
Step: 2 Unlock
Step: 3 Unlock