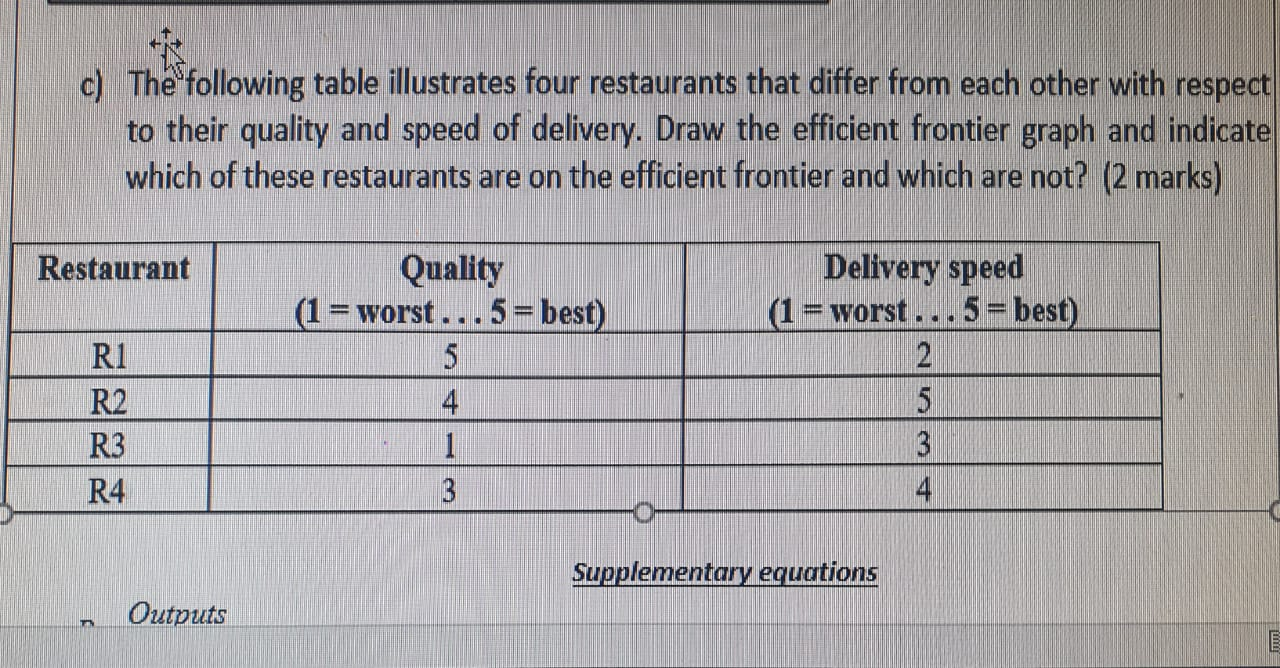
Question: c) The following table illustrates four restaurants that differ from each other with respect to their quality and speed of delivery. Draw the efficient frontier

c) The following table illustrates four

c) The following table illustrates four restaurants that differ from each other with respect to their quality and speed of delivery. Draw the efficient frontier graph and indicate which of these restaurants are on the efficient frontier and which are not? (2 marks) Restaurant Quality (1 = worst ...5=best) Delivery speed (1 = worst ...5=best) R1 R2 R3 R4 Supplementary equations Outputs

Step by Step Solution

There are 3 Steps involved in it

1 Expert Approved Answer
Step: 1 Unlock blur-text-image
Question Has Been Solved by an Expert!

Get step-by-step solutions from verified subject matter experts

Step: 2 Unlock
Step: 3 Unlock

Students Have Also Explored These Related General Management Questions!