

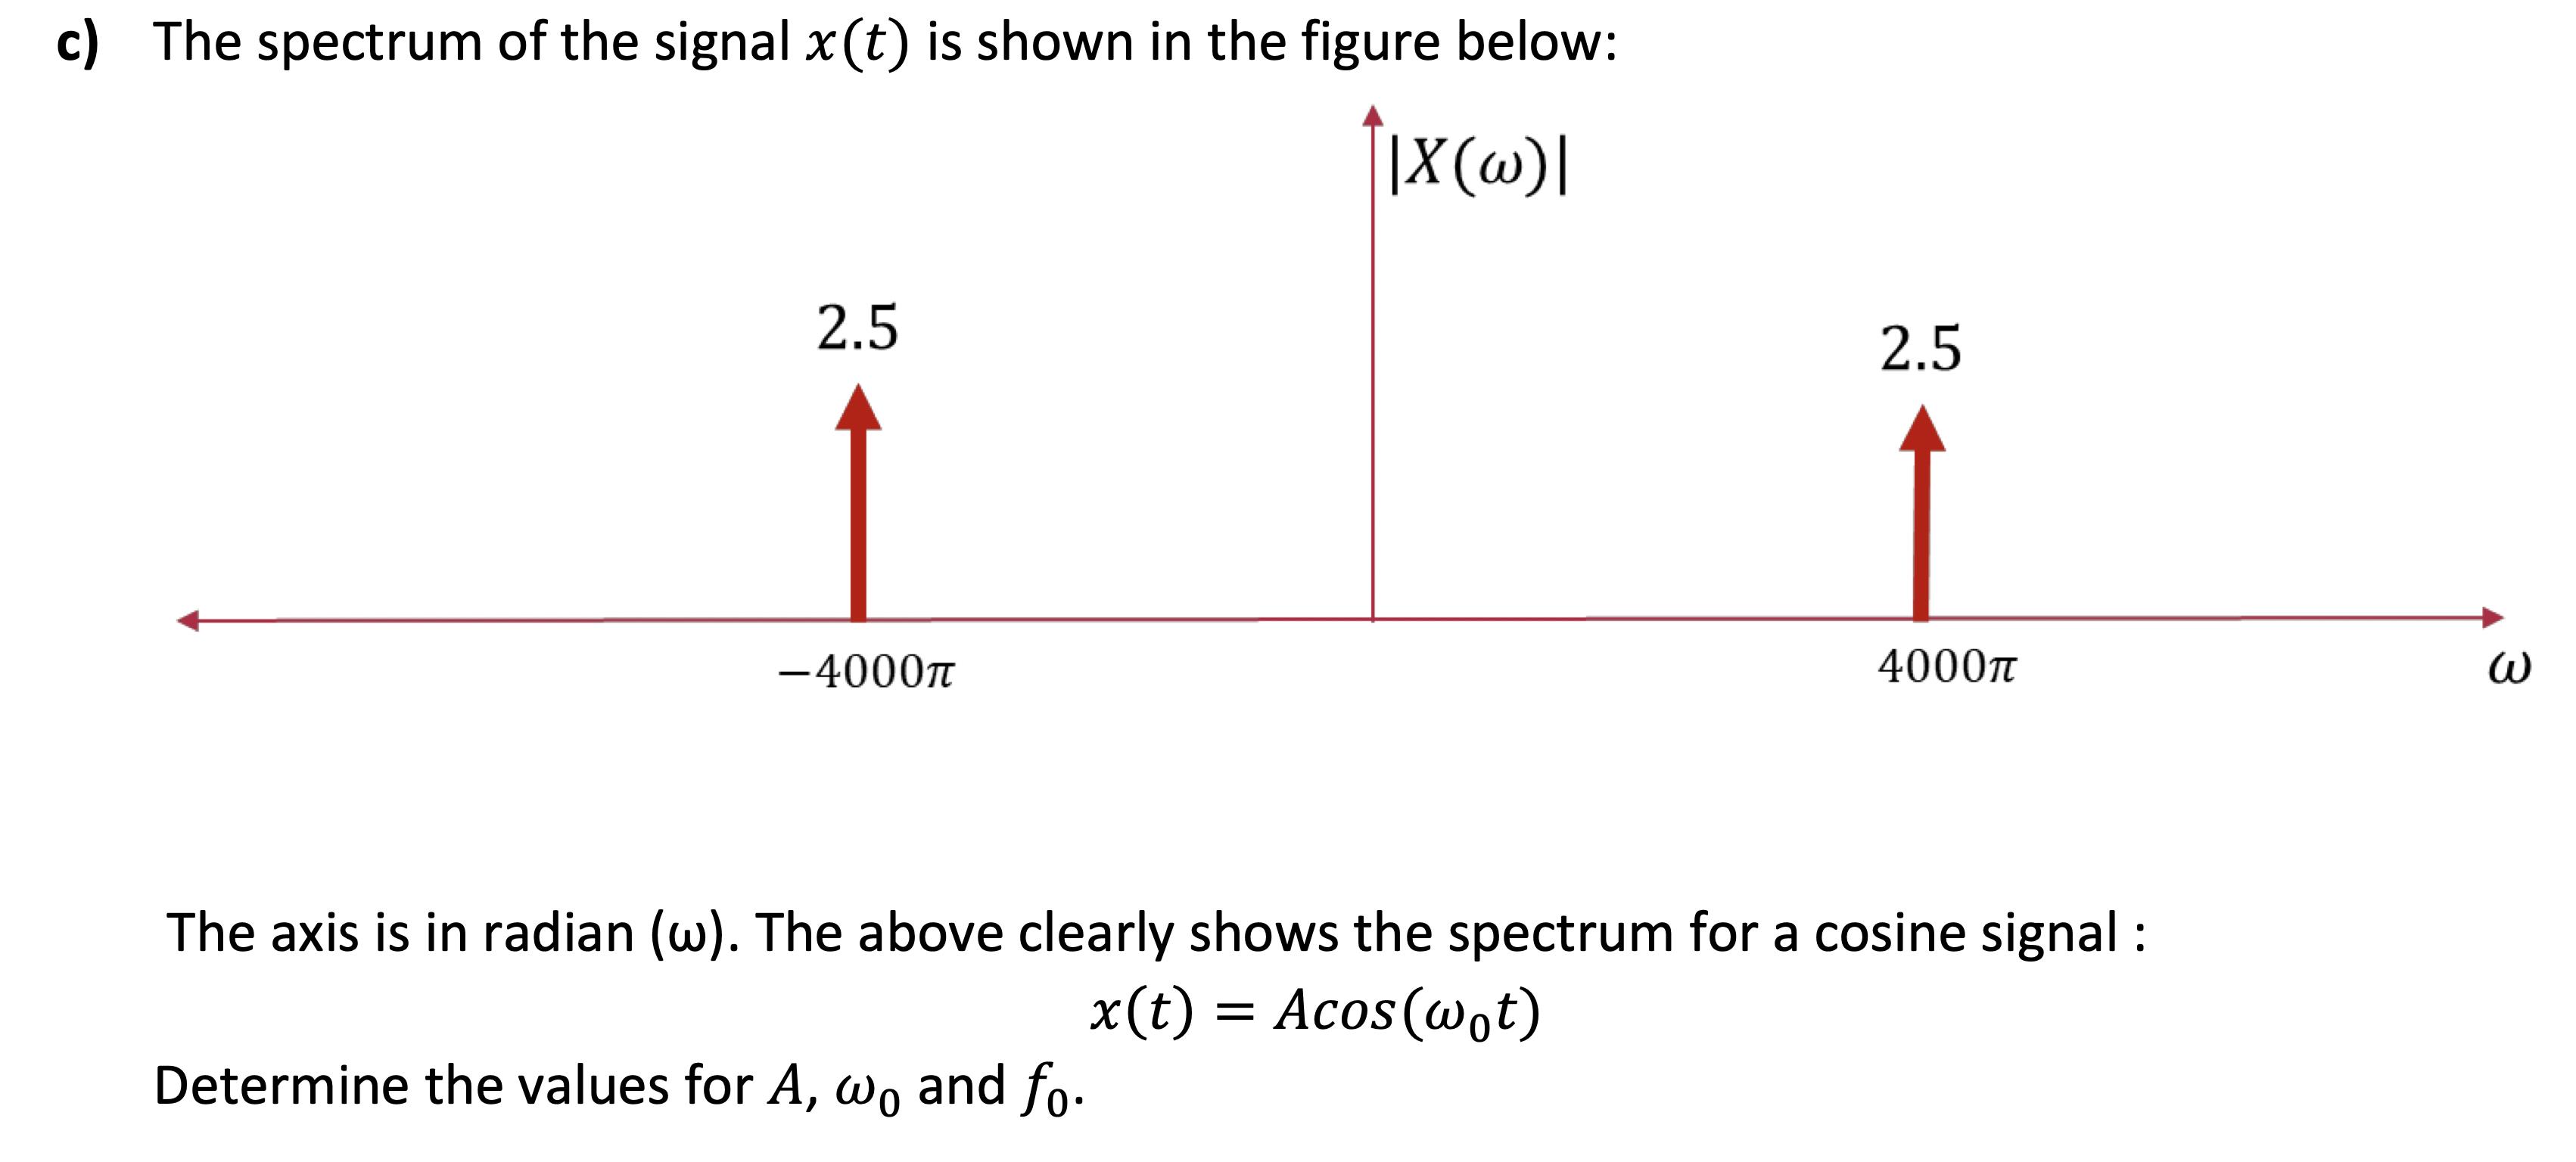
c) The spectrum of the signal x(t) is shown in the figure below: 2.5 2.5 -4000t...
Fantastic news! We've Found the answer you've been seeking!
Question:
Expert Answer:

Posted Date:
