

Question: (c) The table below shows the particle size distribution data for a limestone powder with a particle density of 1650 kg/m. (i) From the
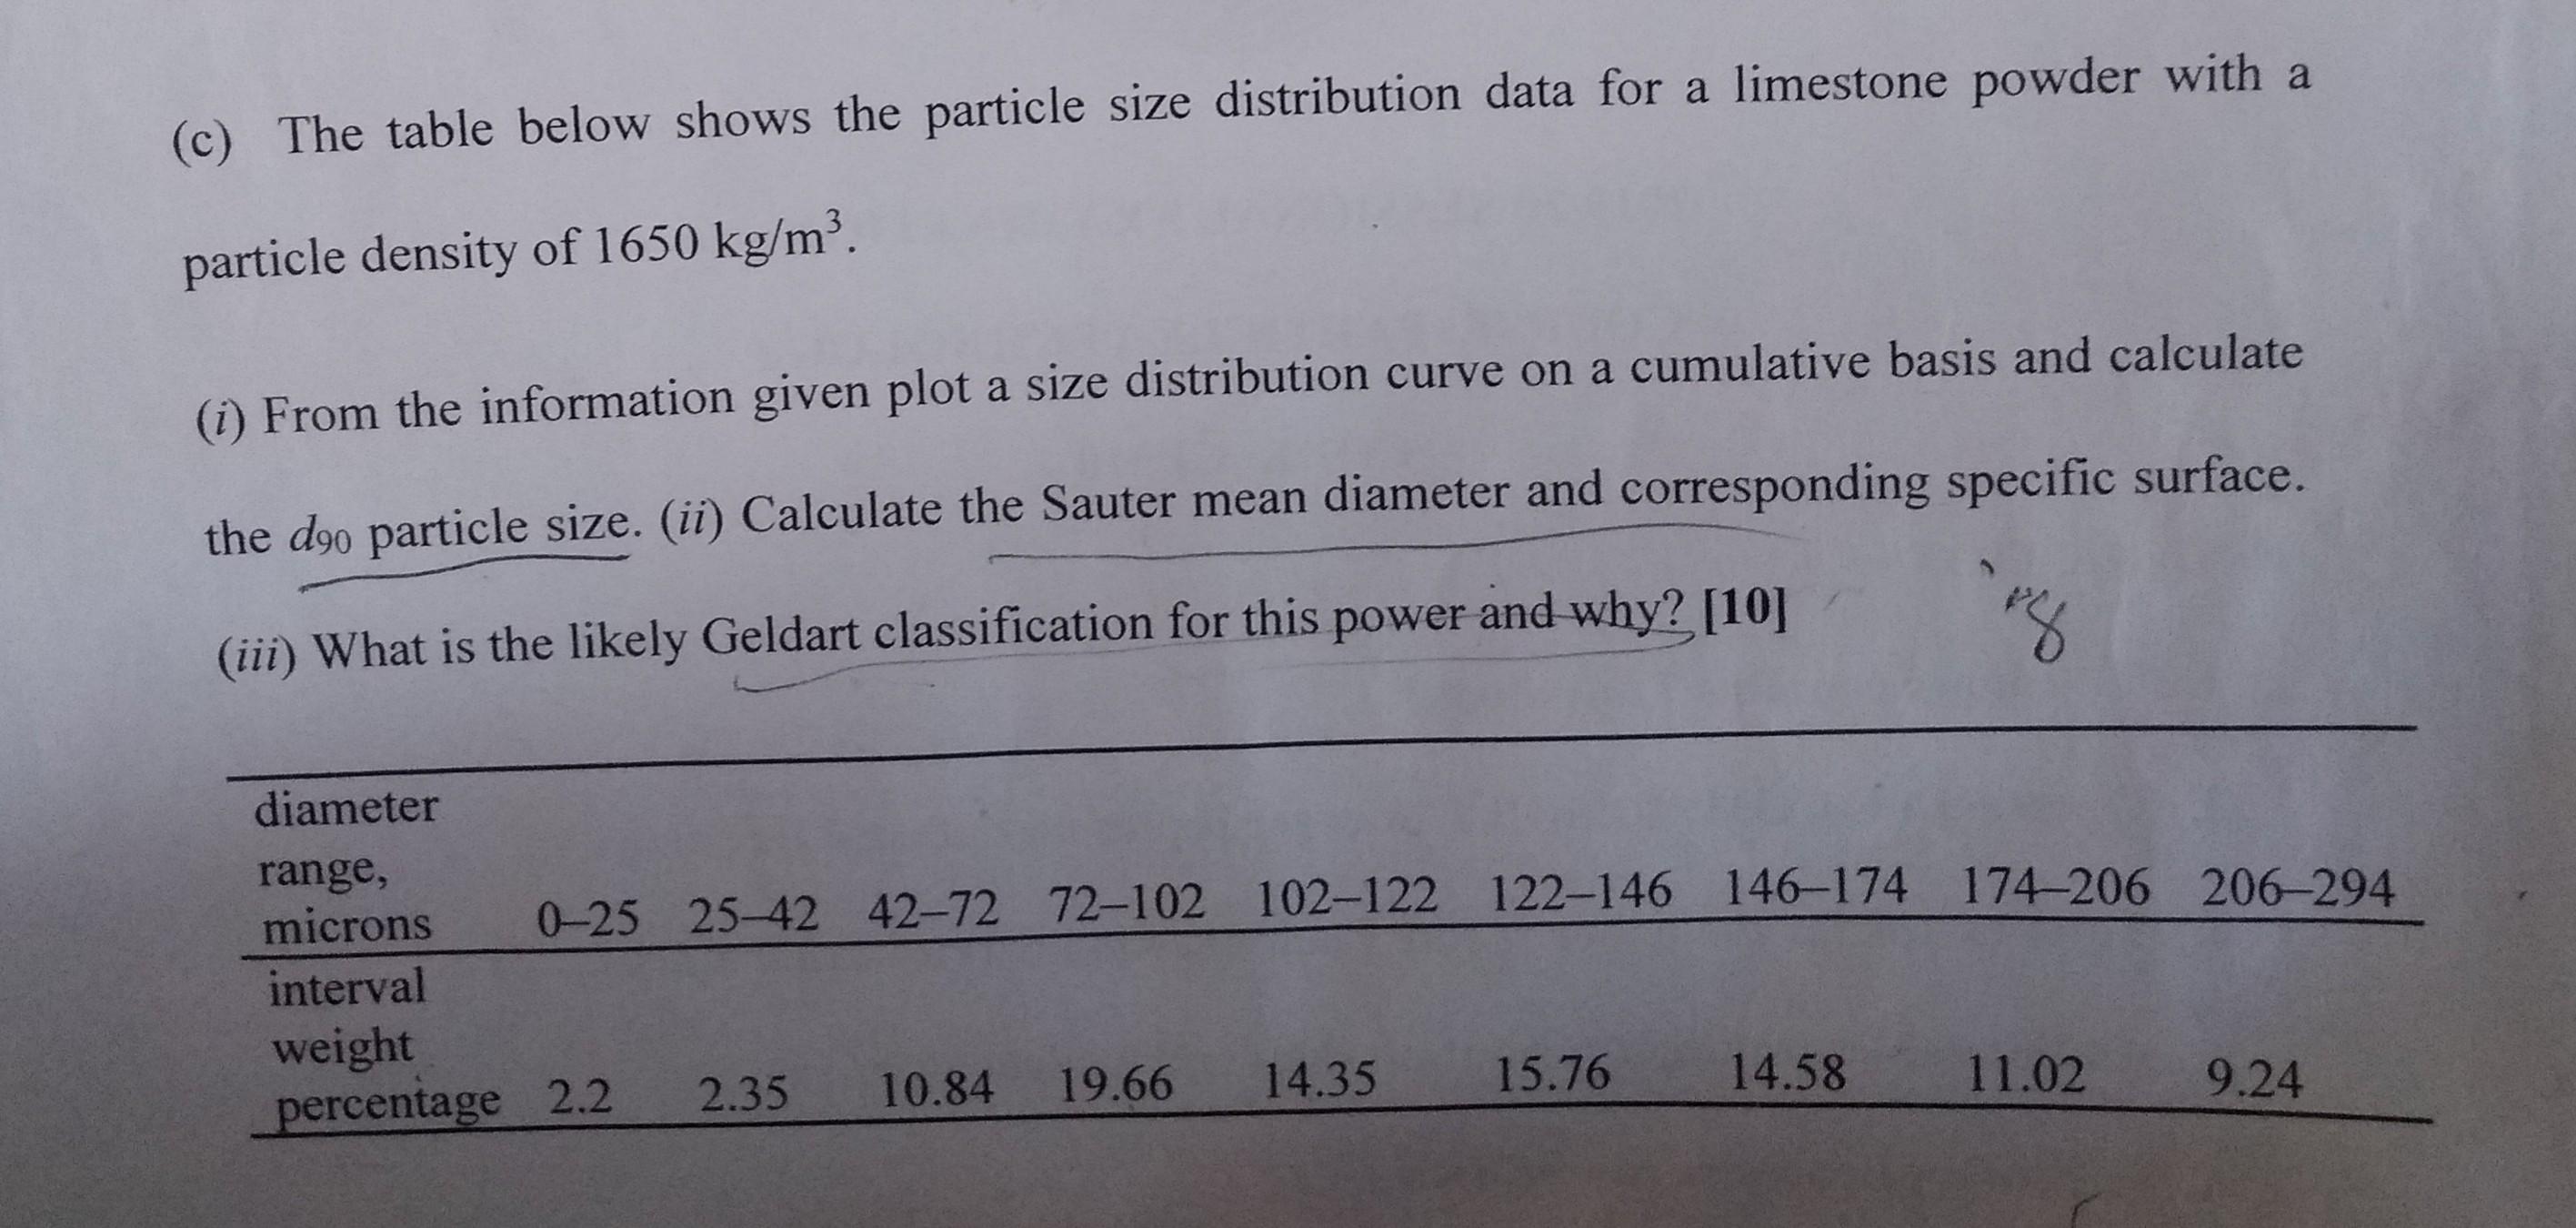
(c) The table below shows the particle size distribution data for a limestone powder with a particle density of 1650 kg/m. (i) From the information given plot a size distribution curve on a cumulative basis and calculate the doo particle size. (ii) Calculate the Sauter mean diameter and corresponding specific surface. (iii) What is the likely Geldart classification for this power and why? [10] diameter range, microns 0-25 25-42 42-72 72-102 102-122 122-146 146-174 174-206 206-294 interval weight percentage 2.2 2.35 10.84 19.66 14.35 15.76 14.58 11.02 9.24
Step by Step Solution
3.64 Rating (154 Votes )
There are 3 Steps involved in it
The given table for the Particle size distribution shows interval weight of the powder for a particu... View full answer

Get step-by-step solutions from verified subject matter experts