

Question: c) Thought question: How do you assess the overall risk in the rise in prices of ingredients to Alpine Cupcakes future? As in question 2,
  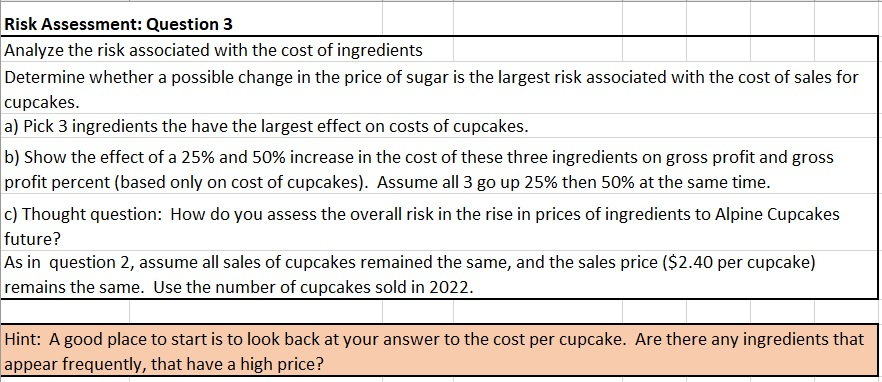      | |||||||
| c) Thought question: How do you assess the overall risk in the rise in prices of ingredients to Alpine Cupcakes future? | |||||||
| As in question 2, assume all sales of cupcakes remained the same, and the sales price ($2.40 per cupcake) remains the same. Use the number of cupcakes sold in 2022. | |||||||
| Hint: A good place to start is to look back at your answer to the cost per cupcake. Are there any ingredients that appear frequently, that have a high price? | |||||||
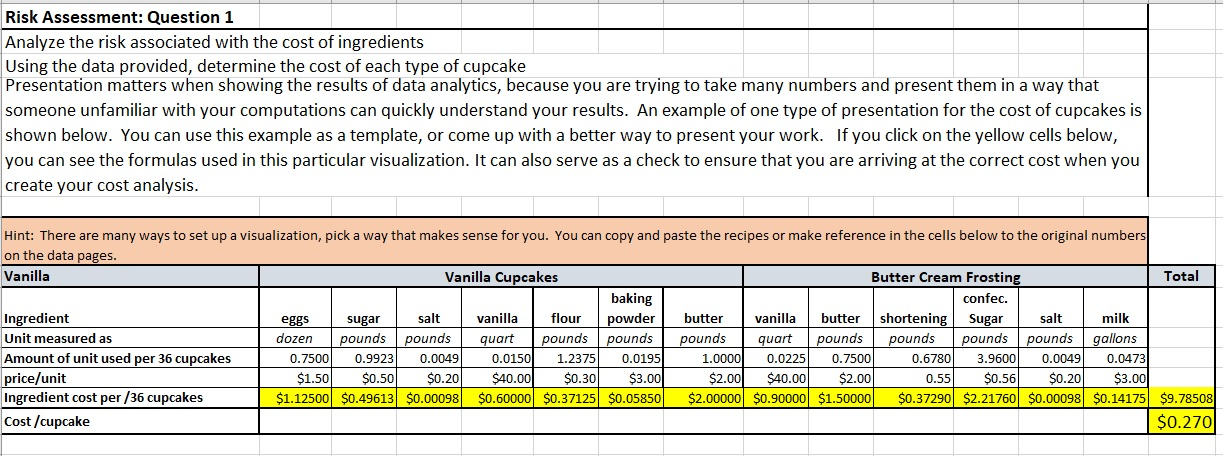
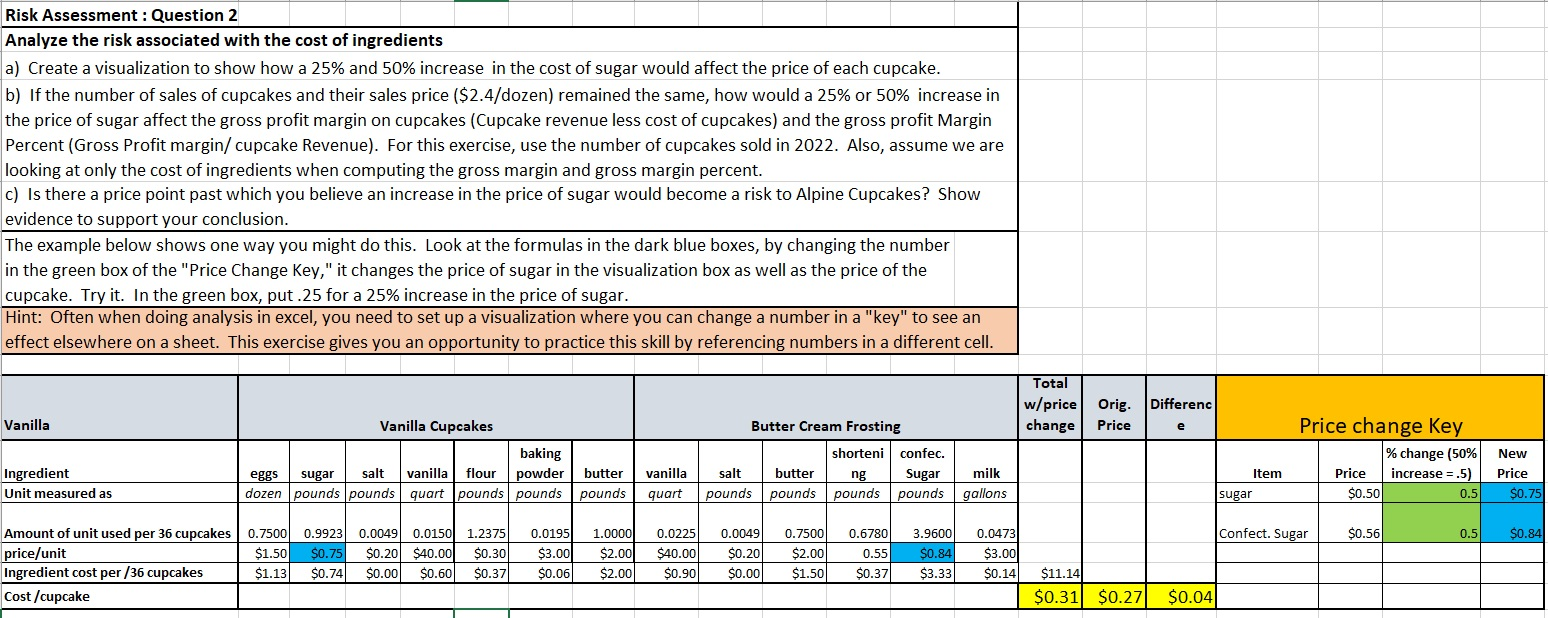
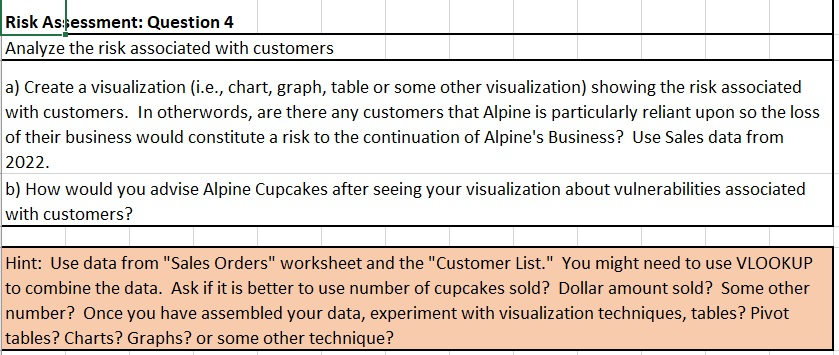
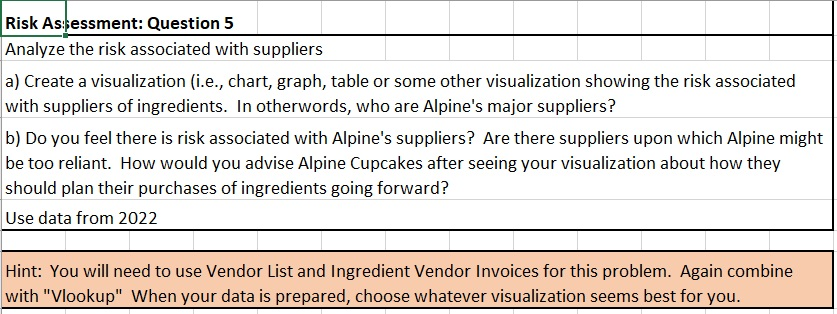
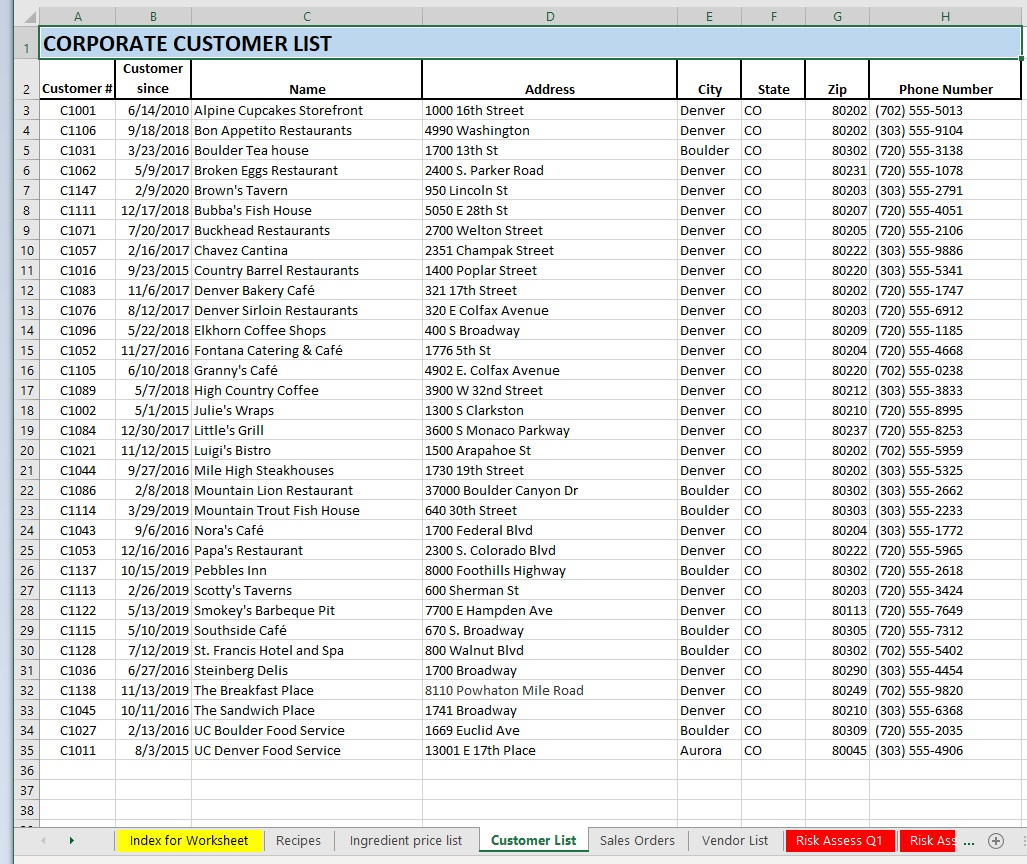
Risk Assessment: Question 1 Analyze the risk associated with the cost of ingredients Using the data provided, determine the cost of each type of cupcake Presentation matters when showing the results of data analytics, because you are trying to take many numbers and present them in a way that someone unfamiliar with your computations can quickly understand your results. An example of one type of presentation for the cost of cupcakes is shown below. You can use this example as a template, or come up with a better way to present your work. If you click on the yellow cells below, you can see the formulas used in this particular visualization. It can also serve as a check to ensure that you are arriving at the correct cost when you create your cost analysis. Hint: There are many ways to set up a visualization, pick a way that makes sense for you. You can copy and paste the recipes or make reference in the cells below to the original numbers on the data pages. Vanilla Vanilla Cupcakes Butter Cream Frosting Total baking confec. Ingredient eggs sugar salt vanilla flour powder butter vanilla butter shortening Sugar salt milk Unit measured as dozen pounds pounds quart pounds pounds pounds quart | pounds pounds pounds pounds | gallons Amount of unit used per 36 cupcakes 0.7500 0.9923 0.0049 0.0150 1.2375 0.0195 1.0000 0.0225 0.7500 0.6780 3.9600 0.0049 0.0473 price/unit $1.50 $0.50 $0.20 $40.00 $0.30 $3.00 $2.00 $40.00 $2.00 0.55 $0.56 $0.20 $3.00 Ingredient cost per /36 cupcakes $1.12500 $0.49613 $0.00098 $0.60000 $0.37125 $0.05850 $2.00000 $0.90000 $1.50000 $0.37290 $2.21760 $0.00098 $0.14175 $9.78508 Cost/cupcake $0.270 Risk Assessment: Question 2 Analyze the risk associated with the cost of ingredients a) Create a visualization to show how a 25% and 50% increase in the cost of sugar would affect the price of each cupcake. b) If the number of sales of cupcakes and their sales price ($2.4/dozen) remained the same, how would a 25% or 50% increase in the price of sugar affect the gross profit margin on cupcakes (Cupcake revenue less cost of cupcakes) and the gross profit Margin Percent (Gross Profit margin/ cupcake Revenue). For this exercise, use the number of cupcakes sold in 2022. Also, assume we are looking at only the cost of ingredients when computing the gross margin and gross margin percent. c) Is there a price point past which you believe an increase in the price of sugar would become a risk to Alpine Cupcakes? Show evidence to support your conclusion. The example below shows one way you might do this. Look at the formulas in the dark blue boxes, by changing the number in the green box of the "Price Change Key," it changes the price of sugar in the visualization box as well as the price of the cupcake. Try it. In the green box, put.25 for a 25% increase in the price of sugar. Hint: Often when doing analysis in excel, you need to set up a visualization where you can change a number in a "key" to see an effect elsewhere on a sheet. This exercise gives you an opportunity to practice this skill by referencing numbers in a different cell. Total w/price change Differenc Orig. Price Vanilla Vanilla Cupcakes baking eggs sugar salt vanilla flour powder butter dozen pounds pounds quart pounds pounds pounds Butter Cream Frosting shorteni confec. vanilla salt butter ng Sugar quart 1 pounds | pounds pounds pounds Price change Key % change (50% Price increase = .5) $0.50 0.5 Item Ingredient Unit measured as milk gallons New Price $0.75 sugar Confect. Sugar $0.56 0.5 $0.84 Amount of unit used per 36 cupcakes price/unit Ingredient cost per/36 cupcakes Cost /cupcake 0.7500 $1.50 $1.13 0.9923| 0.0049 0.0150 $0.75 $0.20 $40.00 $0.74 $0.00 $0.60 1.2375 $0.30 $0.37 0.01951 $3.00 $0.06 1.00001 $2.00 $2.00 0.0225 $40.00 $0.90 0.0049 $0.20 $0.00 0.7500 $2.00 $1.50 0.6780 0.55 $0.37 3.96001 $0.84 $3.33 0.0473 $3.00 $0.14 $11.14 $0.31 $0.27 $0.04 Risk Assessment: Question 3 Analyze the risk associated with the cost of ingredients Determine whether a possible change in the price of sugar is the largest risk associated with the cost of sales for cupcakes. a) Pick 3 ingredients the have the largest effect on costs of cupcakes. b) Show the effect of a 25% and 50% increase in the cost of these three ingredients on gross profit and gross profit percent (based only on cost of cupcakes). Assume all 3 go up 25% then 50% at the same time. c) Thought question: How do you assess the overall risk in the rise in prices of ingredients to Alpine Cupcakes future? As in question 2, assume all sales of cupcakes remained the same, and the sales price ($2.40 per cupcake) remains the same. Use the number of cupcakes sold in 2022. Hint: A good place to start is to look back at your answer to the cost per cupcake. Are there any ingredients that appear frequently, that have a high price? Risk Asessment: Question 4 Analyze the risk associated with customers a) Create a visualization (i.e., chart, graph, table or some other visualization) showing the risk associated with customers. In otherwords, are there any customers that Alpine is particularly reliant upon so the loss of their business would constitute a risk to the continuation of Alpine's Business? Use Sales data from 2022. b) How would you advise Alpine Cupcakes after seeing your visualization about vulnerabilities associated with customers? Hint: Use data from "Sales Orders" worksheet and the "Customer List." You might need to use VLOOKUP to combine the data. Ask if it is better to use number of cupcakes sold? Dollar amount sold? Some other number? Once you have assembled your data, experiment with visualization techniques, tables? Pivot tables? Charts? Graphs? or some other technique? Risk Assessment: Question 5 Analyze the risk associated with suppliers a) Create a visualization (i.e., chart, graph, table or some other visualization showing the risk associated with suppliers of ingredients. In otherwords, who are Alpine's major suppliers? b) Do you feel there is risk associated with Alpine's suppliers? Are there suppliers upon which Alpine might be too reliant. How would you advise Alpine Cupcakes after seeing your visualization about how they should plan their purchases of ingredients going forward? Use data from 2022 Hint: You will need to use Vendor List and Ingredient Vendor Invoices for this problem. Again combine with "Vlookup" When your data is prepared, choose whatever visualization seems best for you. E F G Zip CORPORATE CUSTOMER LIST Customer 2 Customer # since Name C1001 6/14/2010 Alpine Cupcakes Storefront C1106 9/18/2018 Bon Appetito Restaurants C1031 3/23/2016 Boulder Tea house C1062 5/9/2017 Broken Eggs Restaurant C1147 2/9/2020 Brown's Tavern C1111 12/17/2018 Bubba's Fish House C1071 7/20/2017 Buckhead Restaurants C1057 2/16/2017 Chavez Cantina C1016 9/23/2015 Country Barrel Restaurants C1083 11/6/2017 Denver Bakery Caf C1076 8/12/2017 Denver Sirloin Restaurants C1096 5/22/2018 Elkhorn Coffee Shops 15 C1052 11/27/2016 Fontana Catering & Caf C1105 6/10/2018 Granny's Caf C1089 5/7/2018 High Country Coffee C1002 5/1/2015 Julie's Wraps C1084 12/30/2017 Little's Grill C1021 11/12/2015 Luigi's Bistro C1044 9/27/2016 Mile High Steakhouses C1086 2/8/2018 Mountain Lion Restaurant C1114 3/29/2019 Mountain Trout Fish House C1043 9/6/2016 Nora's Caf C1053 12/16/2016 Papa's Restaurant C1137 10/15/2019 Pebbles Inn C1113 2/26/2019 Scotty's Taverns C1122 5/13/2019 Smokey's Barbeque Pit C1115 5/10/2019 Southside Caf C1128 7/12/2019 St. Francis Hotel and Spa C1036 6/27/2016 Steinberg Delis C1138 11/13/2019 The Breakfast Place 11/13/2019 The C1045 10/11/2016 The Sandwich Place C1027 2/13/2016 UC Boulder Food Service C1011 8/3/2015 UC Denver Food Service Address 1000 16th Street 4990 Washington 1700 13th St 2400 S. Parker Road 950 Lincoln St 5050 E 28th St 2700 Welton Street 2351 Champak Street 1400 Poplar Street 321 17th Street 320 E Colfax Avenue 400 S Broadway 1776 5th St 4902 E. Colfax Avenue 3900 W 32nd Street 1300 S Clarkston 3600 S Monaco Parkway 1500 Arapahoe St 1730 19th Street 37000 Boulder Canyon Dr 640 30th Street 1700 Federal Blvd 2300 S. Colorado Blvd 8000 Foothills Highway 600 Sherman St 7700 E Hampden Ave 670 S. Broadway 800 Walnut Blvd 1700 Broadway 8110 Powhaton Mile Road 1741 Broadway 1669 Euclid Ave 13001 E 17th Place City State Denver CO Denver CO Boulder CO Denver CO Denver CO Denver CO Denver Denver CO Denver CO Denver CO Denver Denver CO Denver CO Denver CO Denver co Denver CO Denver CO Denver CO Denver co Boulder CO Boulder CO Denver CO Denver co Boulder CO Denver CO Denver CO Boulder CO Boulder CO Denver CO Denver CO Denver Boulder CO Aurora co Phone Number 80202 (702) 555-5013 80202 (303) 555-9104 80302 (720) 555-3138 80231 (720) 555-1078 80203 (303) 555-2791 80207 (720) 555-4051 80205 (720) 555-2106 80222 (303) 555-9886 80220 (303) 555-5341 80202 (720) 555-1747 80203 (720) 555-6912 80209 (720) 555-1185 80204 (720) 555-4668 80220 (702) 555-0238 80212 (303) 555-3833 80210 (720) 555-8995 80237 (720) 555-8253 80202 (702) 555-5959 80202 (303) 555-5325 80302 (303) 555-2662 80303 (303) 555-2233 80204 (303) 555-1772 80222 (720) 555-5965 80302 (720) 555-2618 80203 (720) 555-3424 80113 (720) 555-7649 80305 (720) 555-7312 80302 (702) 555-5402 80290 (303) 555-4454 80249 (702) 555-9820 80210 (303) 555-6368 80309 (720) 555-2035 80045 (303) 555-4906 Index for Worksheet Recipes Ingredient price list Customer List Sales Orders Vendor List Risk Assess Q1 Risk Ass ... + Alpine Cupcakes Ingredient Price List, by Vendor 3 Bakery Price List 4 Almond milk 5 Baking powder 6 Baking soda 7 Butter 8 Carrots 9 Cider vinegar 10 Cinnamon 11 Cocoa 12 Coconut oil 13 Confec. Sugar 14 Cornstarch 15 Cream 16 Cream cheese 17 Eggs 18 Flour 19 Food color 20 Lemon juice 21 Lemon zest 22 Milk 23 Millet flour 24 Nutmeg 25 Pecans 26 Rice flour 27 Salt 28 Shortening 29 Sour cream 30 Sugar 31 Vanilla 32 Vanilla soymilk 33 Veg. Oil 34 Vegan butter 35 Xanthan gum Pr. Per $4.00 $3.00 $1.40 $2.00 $2.00 $3.00 $9.00 $2.80 $20.00 $0.56 $4.00 $10.00 $5.00 $1.50 $0.30 $8.00 $10.00 $1.50 $3.00 $3.00 $22.00 $5.00 $1.20 $0.20 $0.55 $2.00 $0.50 $40.00 $4.00 $4.00 $3.00 $10.00 Unit gallon pound pound pound pound gallon pound pound gallon pound pound gallon pound dozen pound pint gallon pound gallon pound pound pound pound pound pound pound pound quart gallon gallon pound pound Vendor # Vendor Name V3242 Mountain Dairy Company V2352 Milsap Foods V2352 Milsap Foods V3242 Mountain Dairy Company V4516 Coastal Farms V2352 Milsap Foods V2828 Boulder Spice Importers V2828 Boulder Spice Importers V2352 Milsap Foods V2352 Milsap Foods V2352 Milsap Foods V3242 Mountain Dairy Company V3242 Mountain Dairy Company V3242 Mountain Dairy Company V2352 Milsap Foods V2828 Boulder Spice Importers V4516 Coastal Farms V4516 Coastal Farms V3242 Mountain Dairy Company V2352 Milsap Foods V2828 Boulder Spice Importers V4516 Coastal Farms V2352 Milsap Foods V2352 Milsap Foods V2352 Milsap Foods V3242 Mountain Dairy Company V2352 Milsap Foods V2828 Boulder Spice Importers V3242 Mountain Dairy Company V2352 Milsap Foods V4897 Joe's Organic Supplies V4897 Joe's Organic Supplies Index for Worksheet Recipes Ingredient price list Customer List Vanilla Cupcakes (36) Butter Sugar Flour 2.00 cups 2.25 cups 4.50 cups 0.38 tsp 9.00 eggs 3.00 tsp 1.50 tsp pounds pounds pounds pounds dozen Salt 1 0.99225 1.2375 0.0049 0.75 0.0150 0.0195 Eggs Vanilla Baking powder quart pounds Butter Cream Frosting (36) Butter Shortening Salt Vanilla Confec. Sugar Milk 1.50 cups 1.50 cups 0.38 tsp 4.50 tsp 15.00 cups 0.75 cups pounds pounds pounds quart pounds gallons 0.75 0.678 0.0049 0.0225 3.96 0.04725 Lemon Cupcakes (36) Flour Salt Butter Sugar Eggs Vanilla Lemon zest Milk Lemon juice Index for Worksheet 3.60 cups 0.70 tsp 1.20 cups 2.40 cups 5.00 eggs 1.20 tsp 2.40 tbl 1.20 cups 3.00 tbl Ingredient price list pounds pounds pounds pounds dozen quart pounds (lem gallons gallon Customer List 0.99 0.0091 0.6 1.0584 0.41666667 0.0060 0.0880 0.0756 0.012 Sales Orders Recipes Risk Assessment: Question 1 Analyze the risk associated with the cost of ingredients Using the data provided, determine the cost of each type of cupcake Presentation matters when showing the results of data analytics, because you are trying to take many numbers and present them in a way that someone unfamiliar with your computations can quickly understand your results. An example of one type of presentation for the cost of cupcakes is shown below. You can use this example as a template, or come up with a better way to present your work. If you click on the yellow cells below, you can see the formulas used in this particular visualization. It can also serve as a check to ensure that you are arriving at the correct cost when you create your cost analysis. Hint: There are many ways to set up a visualization, pick a way that makes sense for you. You can copy and paste the recipes or make reference in the cells below to the original numbers on the data pages. Vanilla Vanilla Cupcakes Butter Cream Frosting Total baking confec. Ingredient eggs sugar salt vanilla flour powder butter vanilla butter shortening Sugar salt milk Unit measured as dozen pounds pounds quart pounds pounds pounds quart | pounds pounds pounds pounds | gallons Amount of unit used per 36 cupcakes 0.7500 0.9923 0.0049 0.0150 1.2375 0.0195 1.0000 0.0225 0.7500 0.6780 3.9600 0.0049 0.0473 price/unit $1.50 $0.50 $0.20 $40.00 $0.30 $3.00 $2.00 $40.00 $2.00 0.55 $0.56 $0.20 $3.00 Ingredient cost per /36 cupcakes $1.12500 $0.49613 $0.00098 $0.60000 $0.37125 $0.05850 $2.00000 $0.90000 $1.50000 $0.37290 $2.21760 $0.00098 $0.14175 $9.78508 Cost/cupcake $0.270 Risk Assessment: Question 2 Analyze the risk associated with the cost of ingredients a) Create a visualization to show how a 25% and 50% increase in the cost of sugar would affect the price of each cupcake. b) If the number of sales of cupcakes and their sales price ($2.4/dozen) remained the same, how would a 25% or 50% increase in the price of sugar affect the gross profit margin on cupcakes (Cupcake revenue less cost of cupcakes) and the gross profit Margin Percent (Gross Profit margin/ cupcake Revenue). For this exercise, use the number of cupcakes sold in 2022. Also, assume we are looking at only the cost of ingredients when computing the gross margin and gross margin percent. c) Is there a price point past which you believe an increase in the price of sugar would become a risk to Alpine Cupcakes? Show evidence to support your conclusion. The example below shows one way you might do this. Look at the formulas in the dark blue boxes, by changing the number in the green box of the "Price Change Key," it changes the price of sugar in the visualization box as well as the price of the cupcake. Try it. In the green box, put.25 for a 25% increase in the price of sugar. Hint: Often when doing analysis in excel, you need to set up a visualization where you can change a number in a "key" to see an effect elsewhere on a sheet. This exercise gives you an opportunity to practice this skill by referencing numbers in a different cell. Total w/price change Differenc Orig. Price Vanilla Vanilla Cupcakes baking eggs sugar salt vanilla flour powder butter dozen pounds pounds quart pounds pounds pounds Butter Cream Frosting shorteni confec. vanilla salt butter ng Sugar quart 1 pounds | pounds pounds pounds Price change Key % change (50% Price increase = .5) $0.50 0.5 Item Ingredient Unit measured as milk gallons New Price $0.75 sugar Confect. Sugar $0.56 0.5 $0.84 Amount of unit used per 36 cupcakes price/unit Ingredient cost per/36 cupcakes Cost /cupcake 0.7500 $1.50 $1.13 0.9923| 0.0049 0.0150 $0.75 $0.20 $40.00 $0.74 $0.00 $0.60 1.2375 $0.30 $0.37 0.01951 $3.00 $0.06 1.00001 $2.00 $2.00 0.0225 $40.00 $0.90 0.0049 $0.20 $0.00 0.7500 $2.00 $1.50 0.6780 0.55 $0.37 3.96001 $0.84 $3.33 0.0473 $3.00 $0.14 $11.14 $0.31 $0.27 $0.04 Risk Assessment: Question 3 Analyze the risk associated with the cost of ingredients Determine whether a possible change in the price of sugar is the largest risk associated with the cost of sales for cupcakes. a) Pick 3 ingredients the have the largest effect on costs of cupcakes. b) Show the effect of a 25% and 50% increase in the cost of these three ingredients on gross profit and gross profit percent (based only on cost of cupcakes). Assume all 3 go up 25% then 50% at the same time. c) Thought question: How do you assess the overall risk in the rise in prices of ingredients to Alpine Cupcakes future? As in question 2, assume all sales of cupcakes remained the same, and the sales price ($2.40 per cupcake) remains the same. Use the number of cupcakes sold in 2022. Hint: A good place to start is to look back at your answer to the cost per cupcake. Are there any ingredients that appear frequently, that have a high price? Risk Asessment: Question 4 Analyze the risk associated with customers a) Create a visualization (i.e., chart, graph, table or some other visualization) showing the risk associated with customers. In otherwords, are there any customers that Alpine is particularly reliant upon so the loss of their business would constitute a risk to the continuation of Alpine's Business? Use Sales data from 2022. b) How would you advise Alpine Cupcakes after seeing your visualization about vulnerabilities associated with customers? Hint: Use data from "Sales Orders" worksheet and the "Customer List." You might need to use VLOOKUP to combine the data. Ask if it is better to use number of cupcakes sold? Dollar amount sold? Some other number? Once you have assembled your data, experiment with visualization techniques, tables? Pivot tables? Charts? Graphs? or some other technique? Risk Assessment: Question 5 Analyze the risk associated with suppliers a) Create a visualization (i.e., chart, graph, table or some other visualization showing the risk associated with suppliers of ingredients. In otherwords, who are Alpine's major suppliers? b) Do you feel there is risk associated with Alpine's suppliers? Are there suppliers upon which Alpine might be too reliant. How would you advise Alpine Cupcakes after seeing your visualization about how they should plan their purchases of ingredients going forward? Use data from 2022 Hint: You will need to use Vendor List and Ingredient Vendor Invoices for this problem. Again combine with "Vlookup" When your data is prepared, choose whatever visualization seems best for you. E F G Zip CORPORATE CUSTOMER LIST Customer 2 Customer # since Name C1001 6/14/2010 Alpine Cupcakes Storefront C1106 9/18/2018 Bon Appetito Restaurants C1031 3/23/2016 Boulder Tea house C1062 5/9/2017 Broken Eggs Restaurant C1147 2/9/2020 Brown's Tavern C1111 12/17/2018 Bubba's Fish House C1071 7/20/2017 Buckhead Restaurants C1057 2/16/2017 Chavez Cantina C1016 9/23/2015 Country Barrel Restaurants C1083 11/6/2017 Denver Bakery Caf C1076 8/12/2017 Denver Sirloin Restaurants C1096 5/22/2018 Elkhorn Coffee Shops 15 C1052 11/27/2016 Fontana Catering & Caf C1105 6/10/2018 Granny's Caf C1089 5/7/2018 High Country Coffee C1002 5/1/2015 Julie's Wraps C1084 12/30/2017 Little's Grill C1021 11/12/2015 Luigi's Bistro C1044 9/27/2016 Mile High Steakhouses C1086 2/8/2018 Mountain Lion Restaurant C1114 3/29/2019 Mountain Trout Fish House C1043 9/6/2016 Nora's Caf C1053 12/16/2016 Papa's Restaurant C1137 10/15/2019 Pebbles Inn C1113 2/26/2019 Scotty's Taverns C1122 5/13/2019 Smokey's Barbeque Pit C1115 5/10/2019 Southside Caf C1128 7/12/2019 St. Francis Hotel and Spa C1036 6/27/2016 Steinberg Delis C1138 11/13/2019 The Breakfast Place 11/13/2019 The C1045 10/11/2016 The Sandwich Place C1027 2/13/2016 UC Boulder Food Service C1011 8/3/2015 UC Denver Food Service Address 1000 16th Street 4990 Washington 1700 13th St 2400 S. Parker Road 950 Lincoln St 5050 E 28th St 2700 Welton Street 2351 Champak Street 1400 Poplar Street 321 17th Street 320 E Colfax Avenue 400 S Broadway 1776 5th St 4902 E. Colfax Avenue 3900 W 32nd Street 1300 S Clarkston 3600 S Monaco Parkway 1500 Arapahoe St 1730 19th Street 37000 Boulder Canyon Dr 640 30th Street 1700 Federal Blvd 2300 S. Colorado Blvd 8000 Foothills Highway 600 Sherman St 7700 E Hampden Ave 670 S. Broadway 800 Walnut Blvd 1700 Broadway 8110 Powhaton Mile Road 1741 Broadway 1669 Euclid Ave 13001 E 17th Place City State Denver CO Denver CO Boulder CO Denver CO Denver CO Denver CO Denver Denver CO Denver CO Denver CO Denver Denver CO Denver CO Denver CO Denver co Denver CO Denver CO Denver CO Denver co Boulder CO Boulder CO Denver CO Denver co Boulder CO Denver CO Denver CO Boulder CO Boulder CO Denver CO Denver CO Denver Boulder CO Aurora co Phone Number 80202 (702) 555-5013 80202 (303) 555-9104 80302 (720) 555-3138 80231 (720) 555-1078 80203 (303) 555-2791 80207 (720) 555-4051 80205 (720) 555-2106 80222 (303) 555-9886 80220 (303) 555-5341 80202 (720) 555-1747 80203 (720) 555-6912 80209 (720) 555-1185 80204 (720) 555-4668 80220 (702) 555-0238 80212 (303) 555-3833 80210 (720) 555-8995 80237 (720) 555-8253 80202 (702) 555-5959 80202 (303) 555-5325 80302 (303) 555-2662 80303 (303) 555-2233 80204 (303) 555-1772 80222 (720) 555-5965 80302 (720) 555-2618 80203 (720) 555-3424 80113 (720) 555-7649 80305 (720) 555-7312 80302 (702) 555-5402 80290 (303) 555-4454 80249 (702) 555-9820 80210 (303) 555-6368 80309 (720) 555-2035 80045 (303) 555-4906 Index for Worksheet Recipes Ingredient price list Customer List Sales Orders Vendor List Risk Assess Q1 Risk Ass ... + Alpine Cupcakes Ingredient Price List, by Vendor 3 Bakery Price List 4 Almond milk 5 Baking powder 6 Baking soda 7 Butter 8 Carrots 9 Cider vinegar 10 Cinnamon 11 Cocoa 12 Coconut oil 13 Confec. Sugar 14 Cornstarch 15 Cream 16 Cream cheese 17 Eggs 18 Flour 19 Food color 20 Lemon juice 21 Lemon zest 22 Milk 23 Millet flour 24 Nutmeg 25 Pecans 26 Rice flour 27 Salt 28 Shortening 29 Sour cream 30 Sugar 31 Vanilla 32 Vanilla soymilk 33 Veg. Oil 34 Vegan butter 35 Xanthan gum Pr. Per $4.00 $3.00 $1.40 $2.00 $2.00 $3.00 $9.00 $2.80 $20.00 $0.56 $4.00 $10.00 $5.00 $1.50 $0.30 $8.00 $10.00 $1.50 $3.00 $3.00 $22.00 $5.00 $1.20 $0.20 $0.55 $2.00 $0.50 $40.00 $4.00 $4.00 $3.00 $10.00 Unit gallon pound pound pound pound gallon pound pound gallon pound pound gallon pound dozen pound pint gallon pound gallon pound pound pound pound pound pound pound pound quart gallon gallon pound pound Vendor # Vendor Name V3242 Mountain Dairy Company V2352 Milsap Foods V2352 Milsap Foods V3242 Mountain Dairy Company V4516 Coastal Farms V2352 Milsap Foods V2828 Boulder Spice Importers V2828 Boulder Spice Importers V2352 Milsap Foods V2352 Milsap Foods V2352 Milsap Foods V3242 Mountain Dairy Company V3242 Mountain Dairy Company V3242 Mountain Dairy Company V2352 Milsap Foods V2828 Boulder Spice Importers V4516 Coastal Farms V4516 Coastal Farms V3242 Mountain Dairy Company V2352 Milsap Foods V2828 Boulder Spice Importers V4516 Coastal Farms V2352 Milsap Foods V2352 Milsap Foods V2352 Milsap Foods V3242 Mountain Dairy Company V2352 Milsap Foods V2828 Boulder Spice Importers V3242 Mountain Dairy Company V2352 Milsap Foods V4897 Joe's Organic Supplies V4897 Joe's Organic Supplies Index for Worksheet Recipes Ingredient price list Customer List Vanilla Cupcakes (36) Butter Sugar Flour 2.00 cups 2.25 cups 4.50 cups 0.38 tsp 9.00 eggs 3.00 tsp 1.50 tsp pounds pounds pounds pounds dozen Salt 1 0.99225 1.2375 0.0049 0.75 0.0150 0.0195 Eggs Vanilla Baking powder quart pounds Butter Cream Frosting (36) Butter Shortening Salt Vanilla Confec. Sugar Milk 1.50 cups 1.50 cups 0.38 tsp 4.50 tsp 15.00 cups 0.75 cups pounds pounds pounds quart pounds gallons 0.75 0.678 0.0049 0.0225 3.96 0.04725 Lemon Cupcakes (36) Flour Salt Butter Sugar Eggs Vanilla Lemon zest Milk Lemon juice Index for Worksheet 3.60 cups 0.70 tsp 1.20 cups 2.40 cups 5.00 eggs 1.20 tsp 2.40 tbl 1.20 cups 3.00 tbl Ingredient price list pounds pounds pounds pounds dozen quart pounds (lem gallons gallon Customer List 0.99 0.0091 0.6 1.0584 0.41666667 0.0060 0.0880 0.0756 0.012 Sales Orders Recipes
Step by Step Solution
There are 3 Steps involved in it

Get step-by-step solutions from verified subject matter experts