

Question: c Two standard normal curves are shown below one for the confidence interval calculated in part a and one for the significance test conducted in

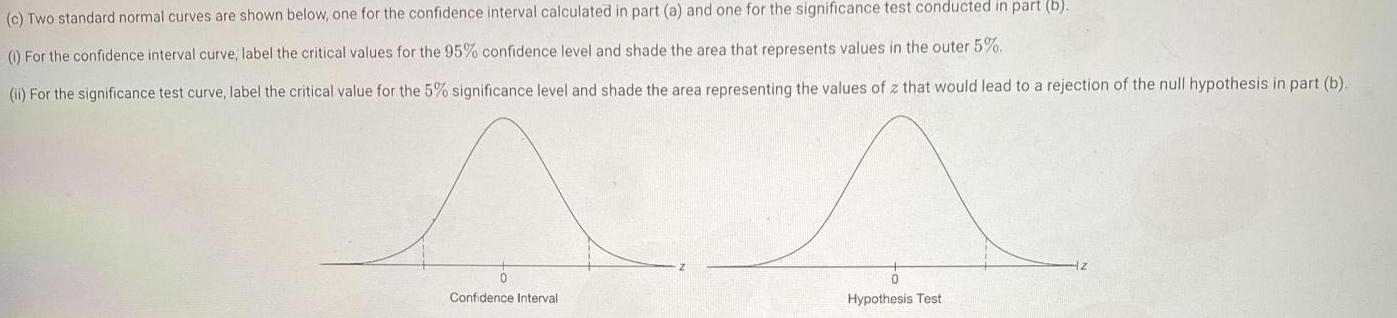
c Two standard normal curves are shown below one for the confidence interval calculated in part a and one for the significance test conducted in part b 1 For the confidence interval curve label the critical values for the 95 confidence level and shade the area that represents values in the outer 5 ii For the significance test curve label the critical value for the 5 significance level and shade the area representing the values of z that would lead to a rejection of the null hypothesis in part b Confidence Interval Hypothesis Test
Step by Step Solution
There are 3 Steps involved in it
1 Expert Approved Answer
Step: 1 Unlock

Question Has Been Solved by an Expert!
Get step-by-step solutions from verified subject matter experts
Step: 2 Unlock
Step: 3 Unlock