

Question: c) Use the BINOMDIST function in Excel to calculate the probability distribution of the number of individuals in the sample of 8 in b who
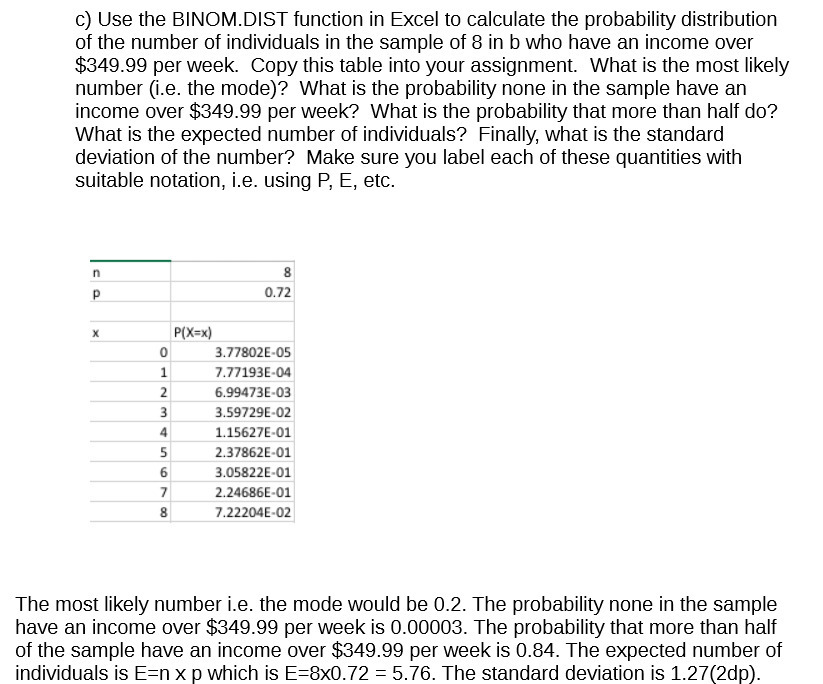
c) Use the BINOMDIST function in Excel to calculate the probability distribution of the number of individuals in the sample of 8 in b who have an income over $349.99 per week. Copy this table into your assignment. What is the most likely number (Le. the mode)? What is the probability none in the sample have an income over $349.99 per week? What is the probability that more than half do? What is the expected number of individuals? Finally, what is the standard deviation of the number? Make sure you label each of these quantities with suitable notation, i.e. using P, E, etc. p 0.12 x P[I=1t} o anemia-05 1 177133504 2 599413503 3 3.5972350: 4 115521501 5 231352501 5 3.053225-01 1 214635501 3 7.1220450: The most likely number i.e. the mode would be 0.2. The probability none in the sample have an income over $349.99 per week is 0.00003. The probability that more than half of the sample have an income over $349.99 per week is 0.34. The expected number of individuals is E:n x p which is E23x0.?2 : 5.76. The standard deviation is 1-2?(2dp)
Step by Step Solution
There are 3 Steps involved in it

Get step-by-step solutions from verified subject matter experts