

Question: c. Using table below i. explain what those different sectors of bonds (names in the rows) means ii. talk about the yield column from the
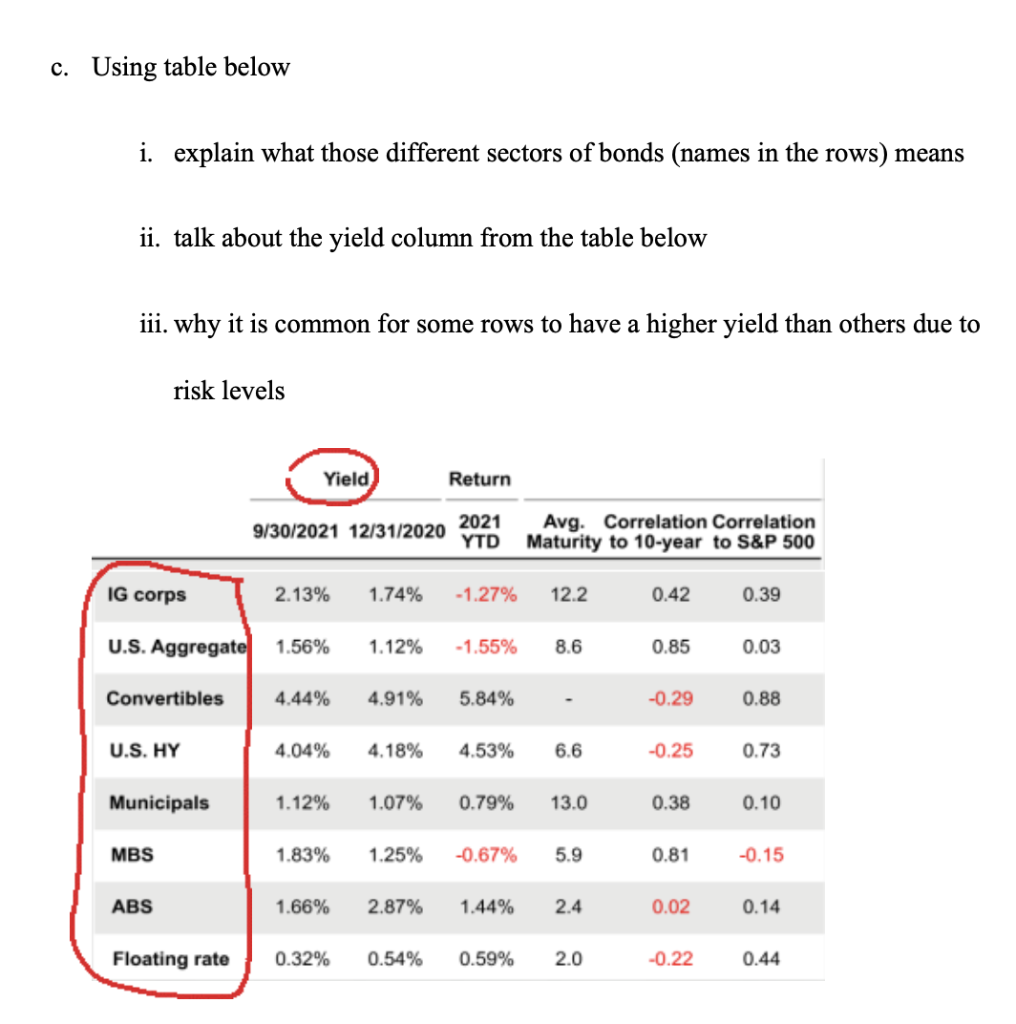
c. Using table below i. explain what those different sectors of bonds (names in the rows) means ii. talk about the yield column from the table below iii. why it is common for some rows to have a higher yield than others due to risk levels Yield Return 9/30/2021 12/31/2020 2021 Avg. Correlation Correlation YTD Maturity to 10-year to S&P 500 IG corps 2.13% 1.74% -1.27% 12.2 0.42 0.39 U.S. Aggregate 1.56% 1.12% -1.55% 8.6 0.85 0.03 Convertibles 4.44% 4.91% 5.84% -0.29 0.88 U.S. HY 4.04% 4.18% 4.53% 6.6 -0.25 0.73 Municipals 1.12% 1.07% 0.79% 13.0 0.38 0.10 MBS 1.83% 1.25% -0.67% 5.9 0.81 -0.15 ABS 1.66% 2.87% 1.44% 2.4 0.02 0.14 Floating rate 0.32% 0.54% 0.59% 2.0 -0.22 0.44
Step by Step Solution
There are 3 Steps involved in it

Get step-by-step solutions from verified subject matter experts