

Question: c) Using the statistics found in (a) and (b), draw a scatter plot, where X variables are the standard deviation, and Y variables are the
c) Using the statistics found in (a) and (b), draw a scatter plot, where X variables are the standard deviation, and Y variables are the average return.
(d) Do you see a clear relationship between average return and standard deviation? How would you interpret this result?
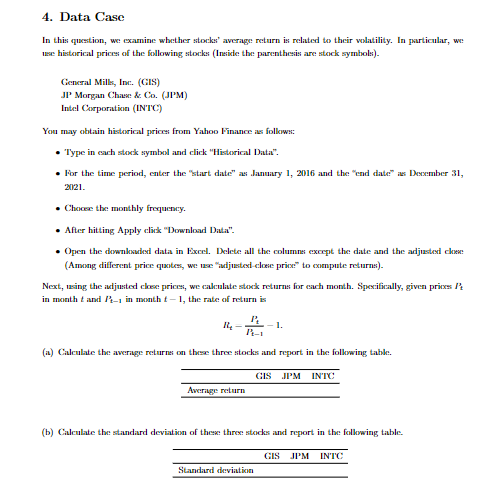
4. DeItal CaLse In this quostion, we examine whether storks' average return is related to their wolatility. In particular, we use historical prices of the following storks (Inside the parenthesis are stock symbols). Gencral Milks, Ins. (GIS) JP3 Morgan Chane &. Co. (J'M) Intel Corporation (INTCO) You may obtain historical prices from Yahoo Finance ias folkws: - 'Type in earh storks symbol and click "Historical Datan". - loor the time period, enter the "start date" as danuary 1, 2016 and the "end date" as Devember 31 , 20121. - Cherese the monthly frequency. - After hitting Apply clivs "Download Data". - Open the downosulod data in Exced. Delete all the columns excrept the date and the adjustusi clowe (Among different price quxites, we use "iadjustesi ciloese prise" to exumpute returns). in month t and Pt1 in month t1, the rate of return is ItPt1Pt31. (a) Cilculate the awerige returns on these three stocks and report in the following table. (b) Calculate the standard deviation of these thres stodes and report in the following table 4. DeItal CaLse In this quostion, we examine whether storks' average return is related to their wolatility. In particular, we use historical prices of the following storks (Inside the parenthesis are stock symbols). Gencral Milks, Ins. (GIS) JP3 Morgan Chane &. Co. (J'M) Intel Corporation (INTCO) You may obtain historical prices from Yahoo Finance ias folkws: - 'Type in earh storks symbol and click "Historical Datan". - loor the time period, enter the "start date" as danuary 1, 2016 and the "end date" as Devember 31 , 20121. - Cherese the monthly frequency. - After hitting Apply clivs "Download Data". - Open the downosulod data in Exced. Delete all the columns excrept the date and the adjustusi clowe (Among different price quxites, we use "iadjustesi ciloese prise" to exumpute returns). in month t and Pt1 in month t1, the rate of return is ItPt1Pt31. (a) Cilculate the awerige returns on these three stocks and report in the following table. (b) Calculate the standard deviation of these thres stodes and report in the following table
Step by Step Solution
There are 3 Steps involved in it

Get step-by-step solutions from verified subject matter experts