

Question: QUESTION TWO (20 MARKS) The data below gives the concentration of copper in tissues of a given plant: (a) (b) Leave 35 42 60
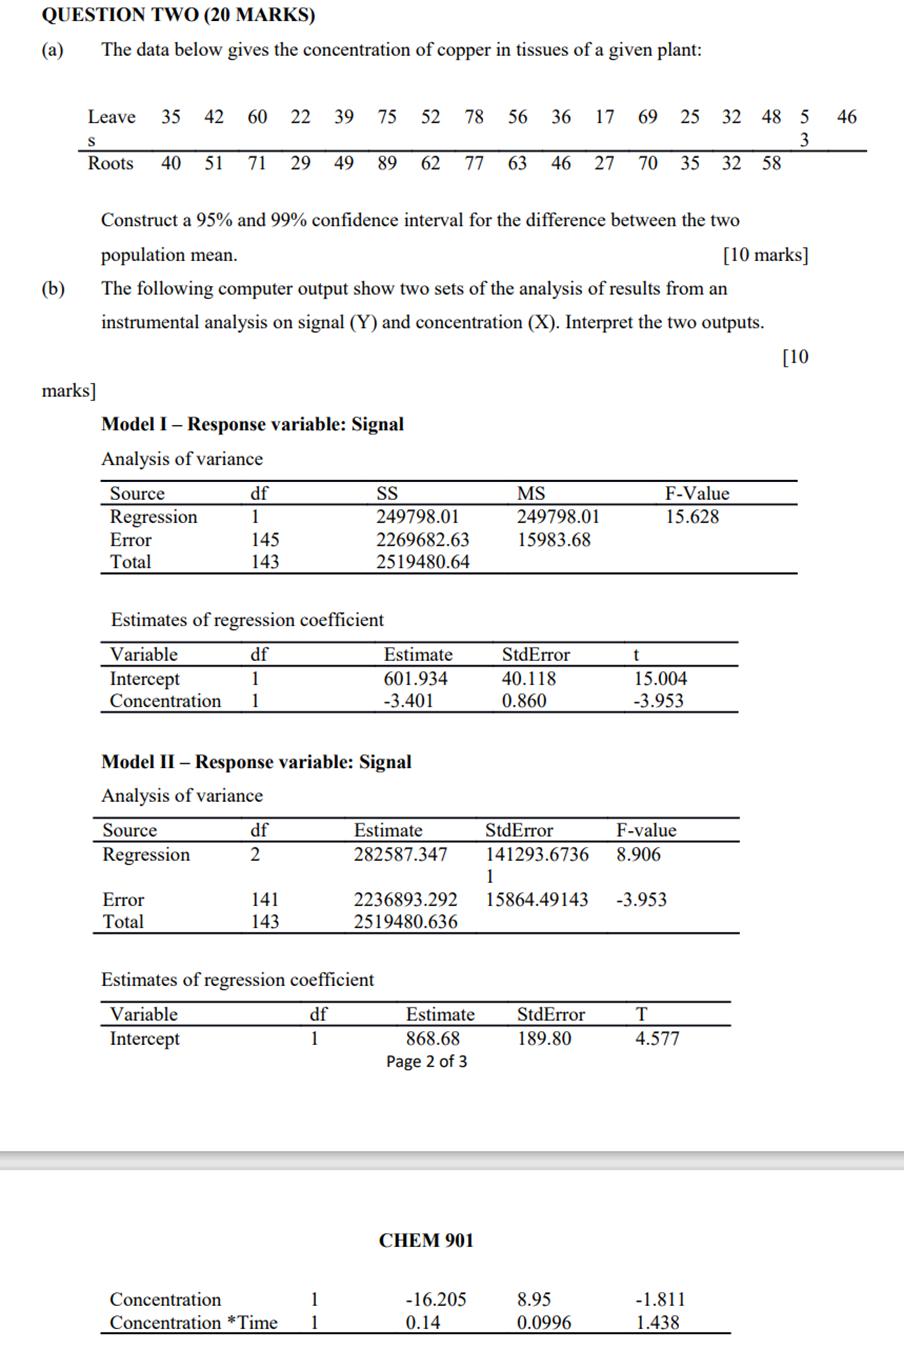
QUESTION TWO (20 MARKS) The data below gives the concentration of copper in tissues of a given plant: (a) (b) Leave 35 42 60 22 39 75 52 78 56 36 17 69 25 32 48 5 46 3 S Roots 40 51 71 29 49 89 62 77 63 46 27 70 35 32 58 marks] Construct a 95% and 99% confidence interval for the difference between the two population mean. [10 marks] The following computer output show two sets of the analysis of results from an instrumental analysis on signal (Y) and concentration (X). Interpret the two outputs. Model I- Response variable: Signal Analysis of variance Source Regression Error Total df 1 Source Regression 145 143 Estimates of regression coefficient Variable df Intercept 1 Concentration 1 Error Total Model II - Response variable: Signal Analysis of variance df 2 141 143 SS 249798.01 2269682.63 2519480.64 Concentration Concentration *Time 1 1 Estimate 601.934 -3.401 Estimates of regression coefficient Variable df Intercept 1 Estimate 282587.347 2236893.292 2519480.636 Estimate 868.68 Page 2 of 3 CHEM 901 -16.205 0.14 MS 249798.01 15983.68 1 StdError 40.118 0.860 StdError 141293.6736 15864.49143 StdError 189.80 8.95 0.0996 F-Value 15.628 t 15.004 -3.953 F-value 8.906 -3.953 T 4.577 -1.811 1.438 [10
Step by Step Solution
There are 3 Steps involved in it

Get step-by-step solutions from verified subject matter experts