

Question: c.2 Create a MATLAB script that generates x-values from - to using linspace with 200 data samples. Define four different y-values as follows: y 1
c.2 Create a MATLAB script that generates x-values from - to using linspace with 200 data samples. Define four different y-values as follows:
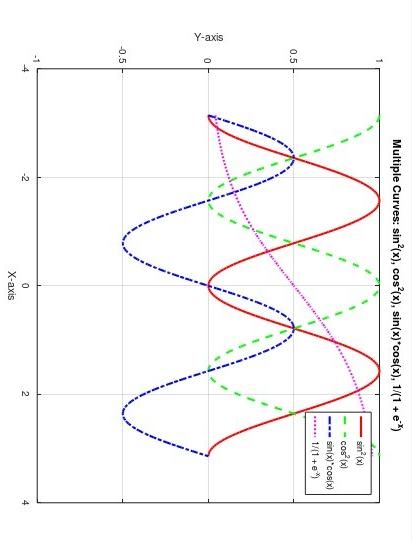
y 1 =sin ^2 (x) y 2 =cos ^2 (x) y 3 =sin(x)cos(x) y 4 = 1/(1+e ^x)
Plot these four curves on the same graph using different line styles and colors. Include appropriate labels for the x-axis and y-axis, a title for the plot, and a legend.
make sure the output plot looks likes the given plot.
Multiple Curves: sin2(x),cos2(x),sin(x)cos(x),1/(1+ex)
Step by Step Solution
There are 3 Steps involved in it
1 Expert Approved Answer
Step: 1 Unlock

Question Has Been Solved by an Expert!
Get step-by-step solutions from verified subject matter experts
Step: 2 Unlock
Step: 3 Unlock