

Caculate for 2022 Net Profit margin Gross profit Percentage Fixed Asset percentage ROE EPS Fiscal Year...
Fantastic news! We've Found the answer you've been seeking!
Question:
Transcribed Image Text:
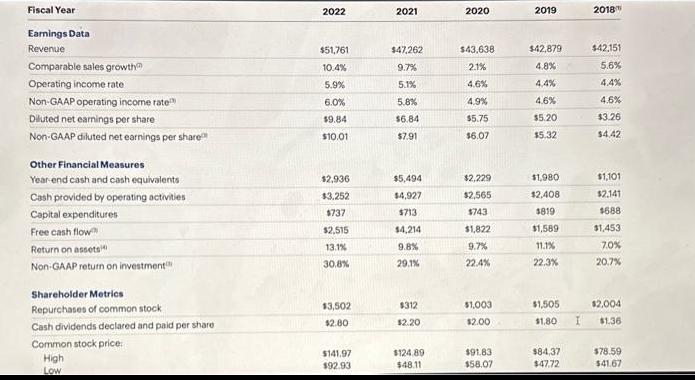
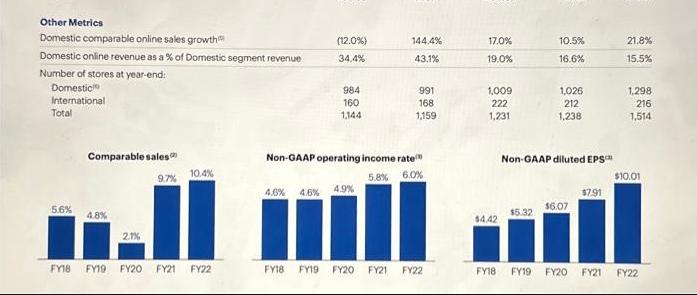
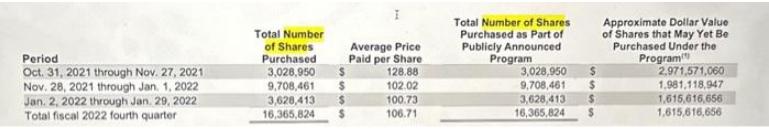
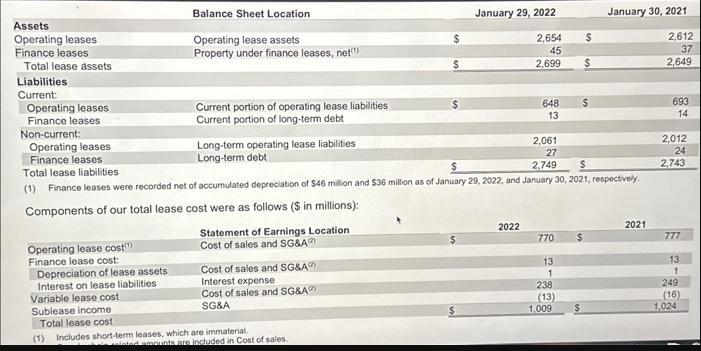
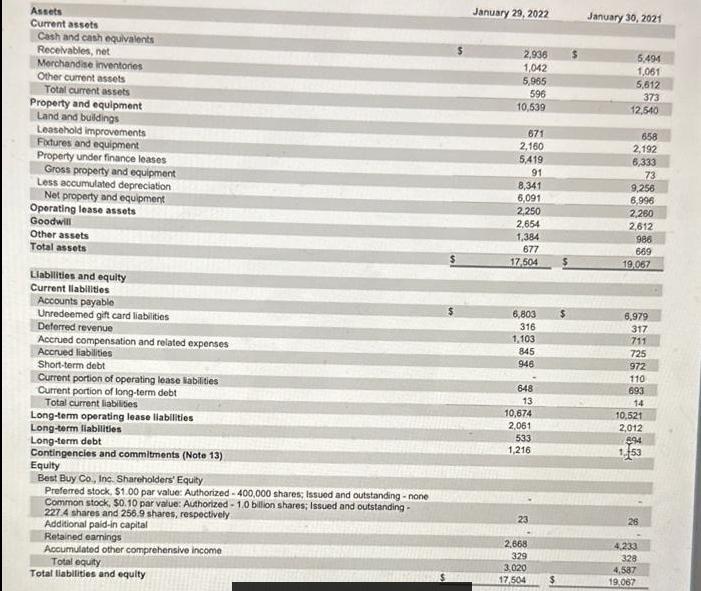
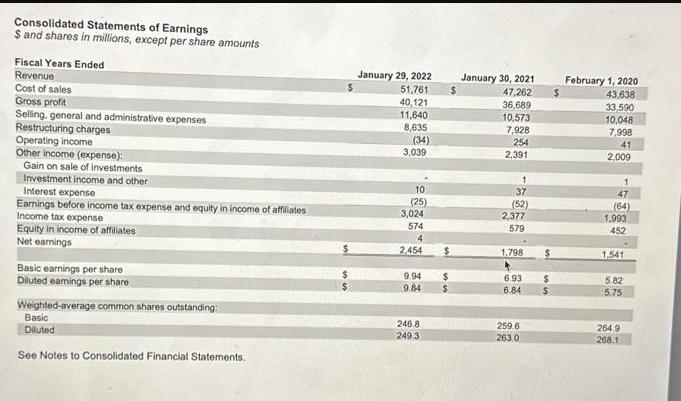
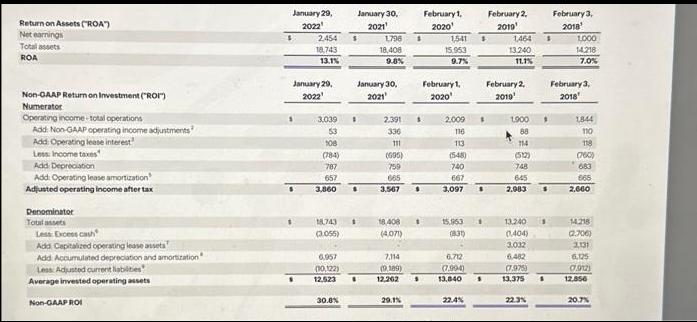
Caculate for 2022 Net Profit margin Gross profit Percentage Fixed Asset percentage ROE EPS Fiscal Year Earnings Data Revenue Comparable sales growth Operating income rate Non-GAAP operating income rate Diluted net earnings per share Non-GAAP diluted net earnings per share Other Financial Measures Year-end cash and cash equivalents Cash provided by operating activities Capital expenditures Free cash flow Return on assets Non-GAAP return on investment Shareholder Metrics Repurchases of common stock Cash dividends declared and paid per share Common stock price: High Low 2022 $51,761 10.4% 5.9% 6.0% $9.84 $10.01 $2,936 $3,252 $737 $2,515 13.1% 30.8% 13,502 $2.00 $141.97 $92.93 2021 $47,262 9.7% 5.1% 5.8% $6.84 $7.91 $5,494 $4,927 $713 $4,214 9.8% 29.1% $312 $2.20 $124.89 $48.11 2020 $43,638 2.1% 4.6% 4.9% $5.75 $6.07 $2,229 $2,565 $743 $1,822 9.7% 22.4% $1,003 $2.00 $91.83 $58.07 2019 $42,879 4.8% 4,4% 4.6% $5.20 $5.32 $1,980 $2,408 $819 $1,589 11.1% 22.3% $1,505 $1,80 $84,37 $47.72 2018 $42,151 5.6% 4.4% 4.6% $3.26 $4.42 $1,101 $2,141 $688 $1,453 7,0% 20.7% $2,004 I $1.36 $78.59 $41.67 Other Metrics Domestic comparable online sales growth Domestic online revenue as a % of Domestic segment revenue Number of stores at year-end: Domestic International Total 5.6% Comparable sales 9.7% 4.8% 2.1% 10.4% FY18 FY19 FY20 FY21 FY22 (12.0%) 34,4% 984 160 1,144 4.6% 4.6% 4.9% 144.4% 43.1% Non-GAAP operating income rate 5.8% 6.0% FY18 FY19 FY20 FY21 991 168 1,159 FY22 17.0% 19.0% 1,009 222 1,231 $4,42 10.5% 16.6% $5.32 1,026 212 1,238 Non-GAAP diluted EPS $6.07 $7.91 21.8% 15.5% 1,298 216 1,514 $10.01 FY18 FY19 FY20 FY21 FY22 Period Oct. 31, 2021 through Nov. 27, 2021 Nov. 28, 2021 through Jan. 1, 2022 Jan. 2, 2022 through Jan. 29, 2022 Total fiscal 2022 fourth quarter Total Number of Shares Purchased 3,028,950 9,708,461 3,628,413 16,365,824 5555 $ $ Average Price Paid per Share 128.88 102.02 100.73 106.71 Total Number of Shares Purchased as Part of Publicly Announced Program 3,028,950 9,708,461 3,628,413 16,365,824 $ Approximate Dollar Value of Shares that May Yet Be Purchased Under the Program 2,971,571,060 1,981,118,947 1,615,616,656 1,615,616,656 Assets Operating leases Finance leases Total lease assets Liabilities Current: Operating lease cost(¹) Finance lease cost: Depreciation of lease assets. Interest on lease liabilities. Variable lease cost Balance Sheet Location Operating lease assets Property under finance leases, net(¹) Sublease income Total lease cost Current portion of operating lease liabilities Current portion of long-term debt Long-term operating lease liabilities Long-term debt Statement of Earnings Location Cost of sales and SG&A) Operating leases Finance leases Non-current: Operating leases 2,061 Finance leases 27 $ 2,749 $ Total lease liabilities (1) Finance leases were recorded net of accumulated depreciation of $46 million and $36 million as of January 29, 2022, and January 30, 2021, respectively. Components of our total lease cost were as follows ($ in millions): Cost of sales and SG&A) Interest expense Cost of sales and SG&A) SG&A (1) Includes short-term leases, which are immaterial. January 29, 2022 2,654 45 2,699 lated amounts are included in Cost of sales, 648 13 2022 770 13 1 238 (13) 1,009 $ $ $ $ January 30, 2021 2021 2,612 37 2,649 693 14 2,012 24 2,743 777 13 1 249 (16) 1,024 Assets Current assets Cash and cash equivalents Receivables, net Merchandise inventories Other current assets Total current assets Property and equipment Land and buildings Leasehold improvements Fixtures and equipment Property under finance leases Gross property and equipment Less accumulated depreciation Net property and equipment Operating lease assets Goodwill Other assets Total assets Liabilities and equity Current liabilities Accounts payable Unredeemed gift card liabilities Deferred revenue Accrued compensation and related expenses Accrued liabilities Short-term debt Current portion of operating lease liabilities Current portion of long-term debt Total current liabilities Long-term operating lease liabilities Long-term liabilities Long-term debt Contingencies and commitments (Note 13) Equity Best Buy Co., Inc. Shareholders' Equity Preferred stock, $1.00 par value: Authorized-400,000 shares; Issued and outstanding-none Common stock, $0.10 par value: Authorized - 1.0 billion shares; Issued and outstanding- 227.4 shares and 256.9 shares, respectively. Additional paid-in capital Retained earnings Accumulated other comprehensive income Total equity Total liabilities and equity January 29, 2022 2,936 1,042 5,965 596 10,539 671 2,160 5,419 91 8,341 6,091 2,250 2,654 1,384 677 17.504 6,803 316 1,103 845 946 648 13 10,674 2,061 533 1,216 23 2,668 329 3,020 17,504 January 30, 2021 5,494 1,061 5,612 373 12,540 658 2,192 6,333 73 9,256 6,996 2,260 2,612 986 669 19.067 6,979 317 711 725 972 110 693 14 10,521 2,012 894 1,53 26 4,233 328 4,587 19,067 Consolidated Statements of Earnings $ and shares in millions, except per share amounts Fiscal Years Ended Revenue Cost of sales Gross profit Selling, general and administrative expenses Restructuring charges Operating income Other income (expense): Gain on sale of investments Investment income and other Interest expense Earnings before income tax expense and equity in income of affiliates Income tax expense Equity in income of affiliates Net earnings Basic earnings per share Diluted earings per share Weighted-average common shares outstanding: Basic Diluted See Notes to Consolidated Financial Statements. January 29, 2022 51,761 40,121 11,640 8,635 (34) 3,039 10 (25) 3,024 574 4 2,454 9.94 $ 9.84 $ 246.8 249.3 $ $ January 30, 2021 47,262 36,689 10,573 7,928 254 2,391 1 37 (52) 2,377 579 1,798 6.93 6.84 259.6 263.0 $ $ February 1, 2020 43,638 33,590 10,048 7,998 41 2,009 1 47 (64) 1.993 452 1,541 5.82 5.75 264.9 268.1 Return on Assets ("ROA) Net earnings Total assets ROA Non-GAAP Return on Investment (ROI) Numerator Operating income-total operations Add: Non-GAAP operating income adjustments Add: Operating lease interest Less Income taxes Add Depreciation Add: Operating lease amortization Adjusted operating income after tax Denominator Total assets Less Excess cash Add Capitalized operating lease assets Add Accumulated depreciation and amortization Less: Adjusted current liabilities Average invested operating assets Non-GAAP ROI January 29, 2022¹ $ 2,454 18,743 13.1% January 29, 2022¹ S 3,039 53 108 (784) 787 657 3,860 18,743 (3.055) 6,957 (10,122) 12.523 30.8% January 30, 2021¹ $ January 30, 2021 1 1,796 18,408 9.8% 1 2.391 336 111 (695) 759 665 3,567 18,408 (4,071) 7,114 (9,189) 12,262 29.1% $ $ $ $ $ February 1, 2020¹ 1,541 $ 15,953 9.7% February 1, 2020' 2,009 1 116 113 (548) 740 667 3,097 15.1961. (831) $ 22.4% 1 6,712 (7,994) 13,840 1 February 2, 2019¹ 1,464 13.240 11.1% February 2, 2019' 1.900 88 114 (512) 748 645 2.983 13.240 (1,404) 3.032 6.482 (7.975) 13,375 22.3% $ $ $ $ s February 3, 2018 1,000 14.218 7.0% February 3, 2018 1844 110 118 (760) 683 665 2,660 14218 (2706) 2,131 6.125 0912) 12,856 20.7% Caculate for 2022 Net Profit margin Gross profit Percentage Fixed Asset percentage ROE EPS Fiscal Year Earnings Data Revenue Comparable sales growth Operating income rate Non-GAAP operating income rate Diluted net earnings per share Non-GAAP diluted net earnings per share Other Financial Measures Year-end cash and cash equivalents Cash provided by operating activities Capital expenditures Free cash flow Return on assets Non-GAAP return on investment Shareholder Metrics Repurchases of common stock Cash dividends declared and paid per share Common stock price: High Low 2022 $51,761 10.4% 5.9% 6.0% $9.84 $10.01 $2,936 $3,252 $737 $2,515 13.1% 30.8% 13,502 $2.00 $141.97 $92.93 2021 $47,262 9.7% 5.1% 5.8% $6.84 $7.91 $5,494 $4,927 $713 $4,214 9.8% 29.1% $312 $2.20 $124.89 $48.11 2020 $43,638 2.1% 4.6% 4.9% $5.75 $6.07 $2,229 $2,565 $743 $1,822 9.7% 22.4% $1,003 $2.00 $91.83 $58.07 2019 $42,879 4.8% 4,4% 4.6% $5.20 $5.32 $1,980 $2,408 $819 $1,589 11.1% 22.3% $1,505 $1,80 $84,37 $47.72 2018 $42,151 5.6% 4.4% 4.6% $3.26 $4.42 $1,101 $2,141 $688 $1,453 7,0% 20.7% $2,004 I $1.36 $78.59 $41.67 Other Metrics Domestic comparable online sales growth Domestic online revenue as a % of Domestic segment revenue Number of stores at year-end: Domestic International Total 5.6% Comparable sales 9.7% 4.8% 2.1% 10.4% FY18 FY19 FY20 FY21 FY22 (12.0%) 34,4% 984 160 1,144 4.6% 4.6% 4.9% 144.4% 43.1% Non-GAAP operating income rate 5.8% 6.0% FY18 FY19 FY20 FY21 991 168 1,159 FY22 17.0% 19.0% 1,009 222 1,231 $4,42 10.5% 16.6% $5.32 1,026 212 1,238 Non-GAAP diluted EPS $6.07 $7.91 21.8% 15.5% 1,298 216 1,514 $10.01 FY18 FY19 FY20 FY21 FY22 Period Oct. 31, 2021 through Nov. 27, 2021 Nov. 28, 2021 through Jan. 1, 2022 Jan. 2, 2022 through Jan. 29, 2022 Total fiscal 2022 fourth quarter Total Number of Shares Purchased 3,028,950 9,708,461 3,628,413 16,365,824 5555 $ $ Average Price Paid per Share 128.88 102.02 100.73 106.71 Total Number of Shares Purchased as Part of Publicly Announced Program 3,028,950 9,708,461 3,628,413 16,365,824 $ Approximate Dollar Value of Shares that May Yet Be Purchased Under the Program 2,971,571,060 1,981,118,947 1,615,616,656 1,615,616,656 Assets Operating leases Finance leases Total lease assets Liabilities Current: Operating lease cost(¹) Finance lease cost: Depreciation of lease assets. Interest on lease liabilities. Variable lease cost Balance Sheet Location Operating lease assets Property under finance leases, net(¹) Sublease income Total lease cost Current portion of operating lease liabilities Current portion of long-term debt Long-term operating lease liabilities Long-term debt Statement of Earnings Location Cost of sales and SG&A) Operating leases Finance leases Non-current: Operating leases 2,061 Finance leases 27 $ 2,749 $ Total lease liabilities (1) Finance leases were recorded net of accumulated depreciation of $46 million and $36 million as of January 29, 2022, and January 30, 2021, respectively. Components of our total lease cost were as follows ($ in millions): Cost of sales and SG&A) Interest expense Cost of sales and SG&A) SG&A (1) Includes short-term leases, which are immaterial. January 29, 2022 2,654 45 2,699 lated amounts are included in Cost of sales, 648 13 2022 770 13 1 238 (13) 1,009 $ $ $ $ January 30, 2021 2021 2,612 37 2,649 693 14 2,012 24 2,743 777 13 1 249 (16) 1,024 Assets Current assets Cash and cash equivalents Receivables, net Merchandise inventories Other current assets Total current assets Property and equipment Land and buildings Leasehold improvements Fixtures and equipment Property under finance leases Gross property and equipment Less accumulated depreciation Net property and equipment Operating lease assets Goodwill Other assets Total assets Liabilities and equity Current liabilities Accounts payable Unredeemed gift card liabilities Deferred revenue Accrued compensation and related expenses Accrued liabilities Short-term debt Current portion of operating lease liabilities Current portion of long-term debt Total current liabilities Long-term operating lease liabilities Long-term liabilities Long-term debt Contingencies and commitments (Note 13) Equity Best Buy Co., Inc. Shareholders' Equity Preferred stock, $1.00 par value: Authorized-400,000 shares; Issued and outstanding-none Common stock, $0.10 par value: Authorized - 1.0 billion shares; Issued and outstanding- 227.4 shares and 256.9 shares, respectively. Additional paid-in capital Retained earnings Accumulated other comprehensive income Total equity Total liabilities and equity January 29, 2022 2,936 1,042 5,965 596 10,539 671 2,160 5,419 91 8,341 6,091 2,250 2,654 1,384 677 17.504 6,803 316 1,103 845 946 648 13 10,674 2,061 533 1,216 23 2,668 329 3,020 17,504 January 30, 2021 5,494 1,061 5,612 373 12,540 658 2,192 6,333 73 9,256 6,996 2,260 2,612 986 669 19.067 6,979 317 711 725 972 110 693 14 10,521 2,012 894 1,53 26 4,233 328 4,587 19,067 Consolidated Statements of Earnings $ and shares in millions, except per share amounts Fiscal Years Ended Revenue Cost of sales Gross profit Selling, general and administrative expenses Restructuring charges Operating income Other income (expense): Gain on sale of investments Investment income and other Interest expense Earnings before income tax expense and equity in income of affiliates Income tax expense Equity in income of affiliates Net earnings Basic earnings per share Diluted earings per share Weighted-average common shares outstanding: Basic Diluted See Notes to Consolidated Financial Statements. January 29, 2022 51,761 40,121 11,640 8,635 (34) 3,039 10 (25) 3,024 574 4 2,454 9.94 $ 9.84 $ 246.8 249.3 $ $ January 30, 2021 47,262 36,689 10,573 7,928 254 2,391 1 37 (52) 2,377 579 1,798 6.93 6.84 259.6 263.0 $ $ February 1, 2020 43,638 33,590 10,048 7,998 41 2,009 1 47 (64) 1.993 452 1,541 5.82 5.75 264.9 268.1 Return on Assets ("ROA) Net earnings Total assets ROA Non-GAAP Return on Investment (ROI) Numerator Operating income-total operations Add: Non-GAAP operating income adjustments Add: Operating lease interest Less Income taxes Add Depreciation Add: Operating lease amortization Adjusted operating income after tax Denominator Total assets Less Excess cash Add Capitalized operating lease assets Add Accumulated depreciation and amortization Less: Adjusted current liabilities Average invested operating assets Non-GAAP ROI January 29, 2022¹ $ 2,454 18,743 13.1% January 29, 2022¹ S 3,039 53 108 (784) 787 657 3,860 18,743 (3.055) 6,957 (10,122) 12.523 30.8% January 30, 2021¹ $ January 30, 2021 1 1,796 18,408 9.8% 1 2.391 336 111 (695) 759 665 3,567 18,408 (4,071) 7,114 (9,189) 12,262 29.1% $ $ $ $ $ February 1, 2020¹ 1,541 $ 15,953 9.7% February 1, 2020' 2,009 1 116 113 (548) 740 667 3,097 15.1961. (831) $ 22.4% 1 6,712 (7,994) 13,840 1 February 2, 2019¹ 1,464 13.240 11.1% February 2, 2019' 1.900 88 114 (512) 748 645 2.983 13.240 (1,404) 3.032 6.482 (7.975) 13,375 22.3% $ $ $ $ s February 3, 2018 1,000 14.218 7.0% February 3, 2018 1844 110 118 (760) 683 665 2,660 14218 (2706) 2,131 6.125 0912) 12,856 20.7%
Expert Answer:
Answer rating: 100% (QA)
Net Profit Margin To calculate the net profit margin for 2022 we need to divide the net profit by th... View the full answer

Related Book For 
Fundamentals of Investing
ISBN: 978-0133075359
12th edition
Authors: Scott B. Smart, Lawrence J. Gitman, Michael D. Joehnk
Posted Date:
Students also viewed these accounting questions
-
Tioga Company manufactures sophisticated lenses and mirrors used in large optical telescopes. The company is now preparing its annual profit plan. As part of its analysis of the profitability of...
-
Canadian media and communications giant Rogers Communications Inc. is a publicly listed firm. Founded by Edward Rogers in 1960 with headquarters in Toronto, Ontario, the firm is now worth billions of...
-
The latitude allowed by Generally Accepted Accounting Principles (GAAP) enables managers to exercise judgment in preparing financial statements. Managers can exercise such discretion to report smooth...
-
A survey of recent masters of business administration (MBAs) reveals that their starting salaries follow a normal distribution with mean $48,000 and standard deviation $9,000. Find the probability...
-
A flat (unbanked) curve on a highway has a radius of 220.0 m. A car rounds the curve ata speed of 25.0 m/s. (a) What is the minimum coefficient of friction that will prevent sliding? (b) Suppose the...
-
A nearsighted person cannot focus clearly on objects more distant than 225 cm from her eye. What power lenses are required for her to see distant objects clearly?
-
Which parts of the accounting equation does a sale on account affect? a. Accounts receivable and Accounts payable b. Accounts receivable and Retained earnings c. Accounts payable and Retained...
-
On March 1, a securities analyst recommended General Cinema stock as a good purchase in the early summer. The portfolio manager plans to buy 20,000 shares of the stock on June 1 but is concerned that...
-
Qs 12 and 13 - Please help with the following practice exam. Prof provided the answer key but REQUIRES showing the solution/analysis using Excel functions/formulas STEP-BY-STEP. Thank you. Q12....
-
Suppose there's an appliance store that sells refrigerators. It could set its price high and sell very few refrigerators, or it could set its price low and sell many more refrigerators. The following...
-
Discuss the implications of "postmodernism" for social theory, particularly in terms of its critiques of metanarratives, its emphasis on cultural pluralism and hybridity, and its impact on notions of...
-
Incentives to Exercise: What Works Best? In the study described in Exercise 5.29, the goal for each of the overweight participants in the study was to walk 7000 steps a day. The study lasted 100 days...
-
Which type of market characterizes most businesses operating in the United States today?
-
Explain why accounting profit provides very useful information. Explain why economic profit provides very useful information.
-
Explain why the demand curve facing the individual firm in a perfectly competitive industry is a horizontal line.
-
Why might a firm continue to produce in the short run even though the market price is less than its average total cost?
-
Mira is pushing a box along a level floor with a force of 130 pounds at an angle of 35. How much work is done if she moves the box 18 feet?
-
4. Jobe dy -Y 2 et by
-
What is the major source of return to commodities speculators? How important is current income from dividends and interest?
-
You have been asked for your advice in selecting a portfolio of assets and have been supplied with the following data. You have been told that you can create 2 portfoliosone consisting of assets A...
-
Use the table of annual returns in Problem for Home Depot (HD) and Lowes (LOW) to create an Excel spreadsheet that calculates the standard deviation of annual returns for HD, LOW, and the equally...
-
a. State the functions that apply to cash disbursements transactions. b. For each cash disbursements function, indicate (1) the department that performs the function and (2) the principal document or...
-
For each function pertaining to cash disbursements transactions, indicate the applicability, if any, of (a) proper authorization (b) independent checks.
-
a. What is the direction of testing controls for purchases transactions that pertains to the existence or occurrence assertion? b. What is the direction of testing controls for purchases transactions...

Study smarter with the SolutionInn App