Question: Caf Michigan's manager, Gary Stark, suspects that demand for mocha latte coffees depends on the price being charged. Based on historical observations, Gary has gathered
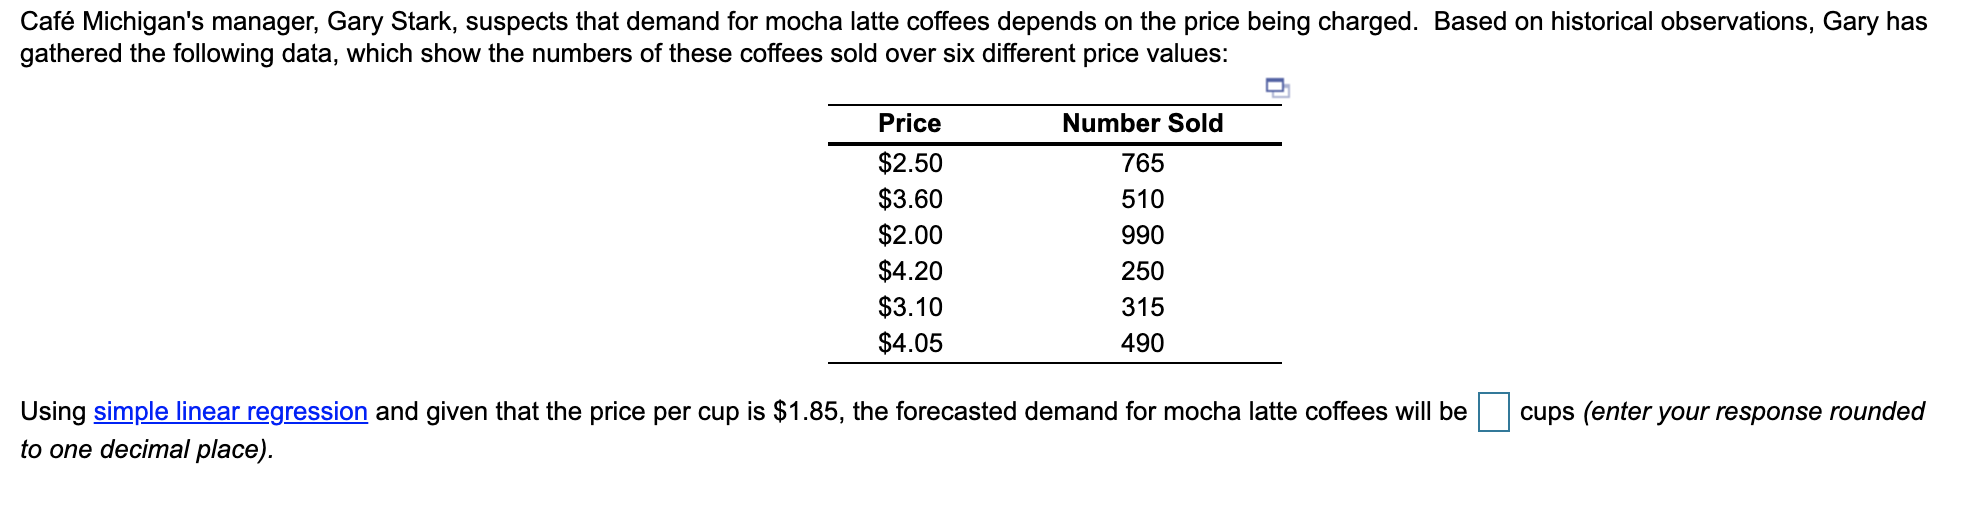
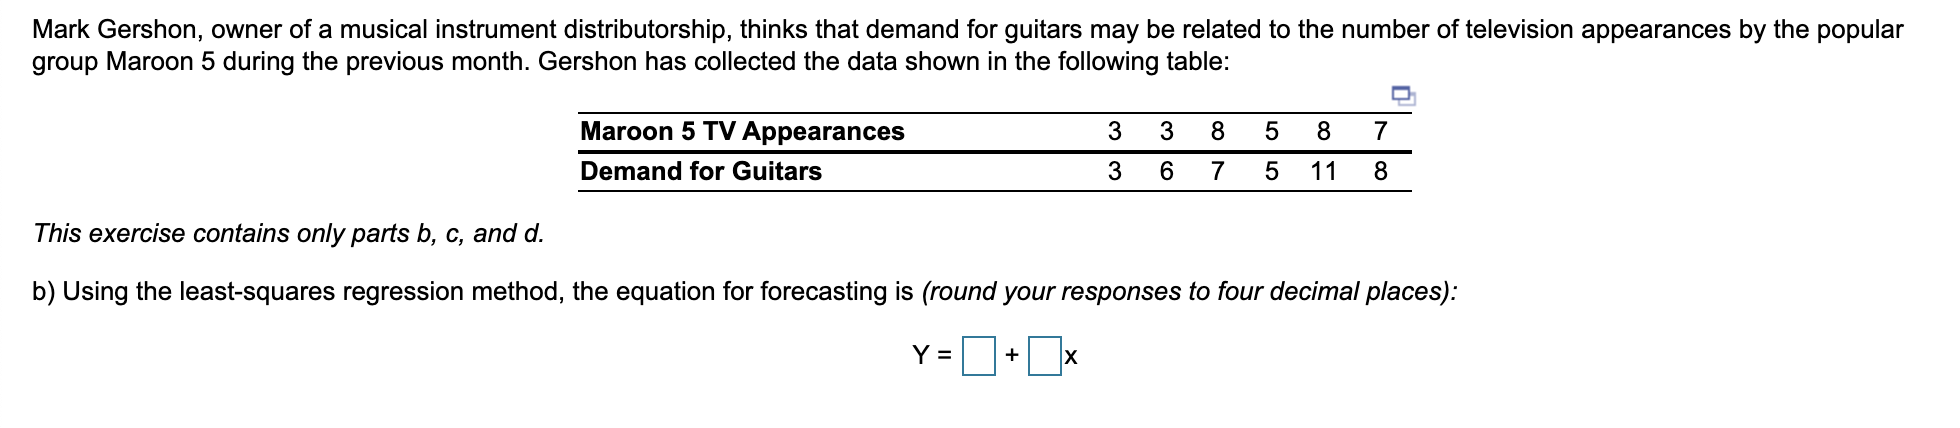
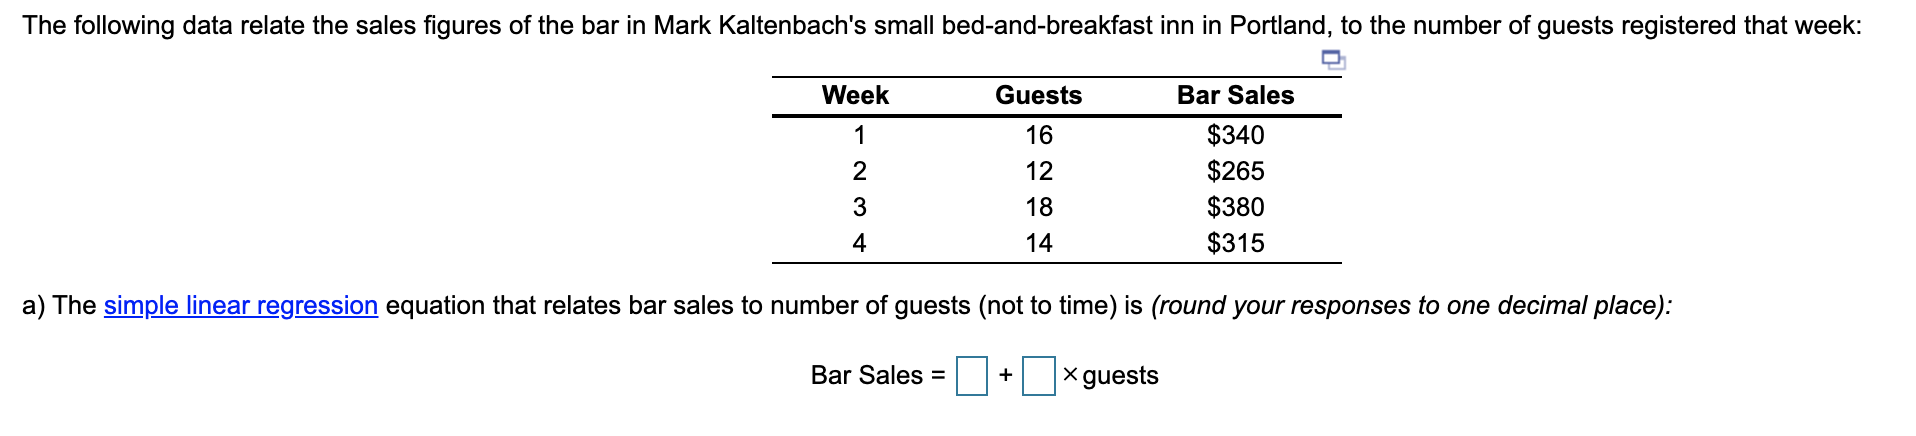
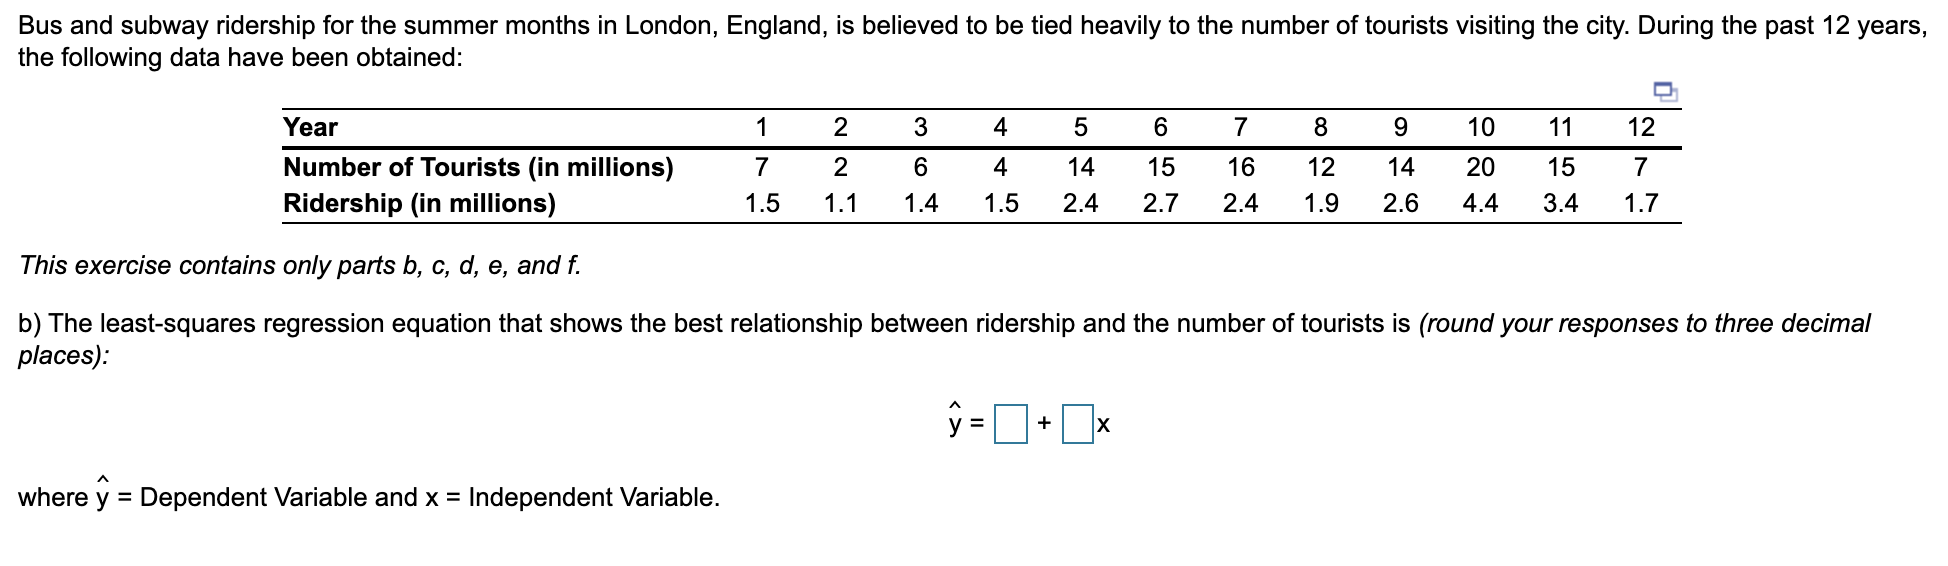
Caf Michigan's manager, Gary Stark, suspects that demand for mocha latte coffees depends on the price being charged. Based on historical observations, Gary has gathered the following data, which show the numbers of these coffees sold over six different price values: Price Number Sold $2.50 $3.60 $2.00 $4.20 $3.10 $4.05 765 510 990 250 315 490 Using simple linear regression and given that the price per cup is $1.85, the forecasted demand for mocha latte coffees will be cups (enter your response rounded to one decimal place). Mark Gershon, owner of a musical instrument distributorship, thinks that demand for guitars may be related to the number of television appearances by the popular group Maroon 5 during the previous month. Gershon has collected the data shown in the following table: 3 3 8 5 8 7 Maroon 5 TV Appearances Demand for Guitars 3 6 7 5 11 8 This exercise contains only parts b, c, and d. b) Using the least-squares regression method, the equation for forecasting is (round your responses to four decimal places): Y= + X The following data relate the sales figures of the bar in Mark Kaltenbach's small bed-and-breakfast inn in Portland, to the number of guests registered that week: Week Guests 1 16 2 12 Bar Sales $340 $265 $380 $315 18 3 4 14 a) The simple linear regression equation that relates bar sales to number of guests (not to time) is (round your responses to one decimal place): Bar Sales = + x guests Bus and subway ridership for the summer months in London, England, is believed to be tied heavily to the number of tourists visiting the city. During the past 12 years, the following data have been obtained: 1 2 3 4 5 6 7 8 9 10 11 12 Year Number of Tourists (in millions) Ridership (in millions) 7 2 6 4 15 12 7 14 2.4 16 2.4 14 2.6 20 4.4 15 3.4 1.5 1.1 1.4 1.5 2.7 1.9 1.7 This exercise contains only parts b, c, d, e, and f. b) The least-squares regression equation that shows the best relationship between ridership and the number of tourists is (round your responses to three decimal places): y = + IX where y = Dependent Variable and x = Independent Variable


