

Question: Calculate 7 J, K, L, M, and N using chart above 1) 2) 3) 4) Variables for questions 5-11 Current Assets Total Assets Current Liabilities
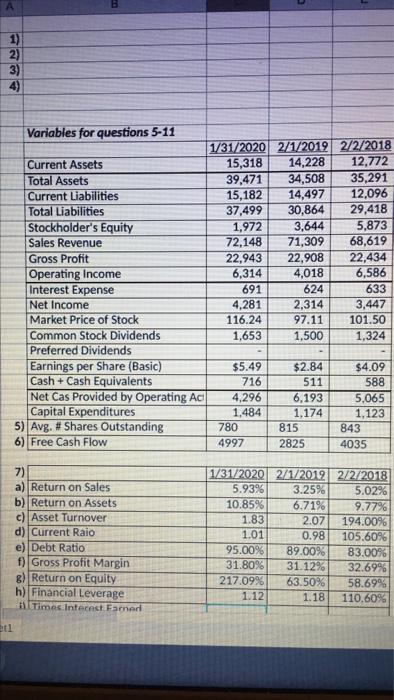
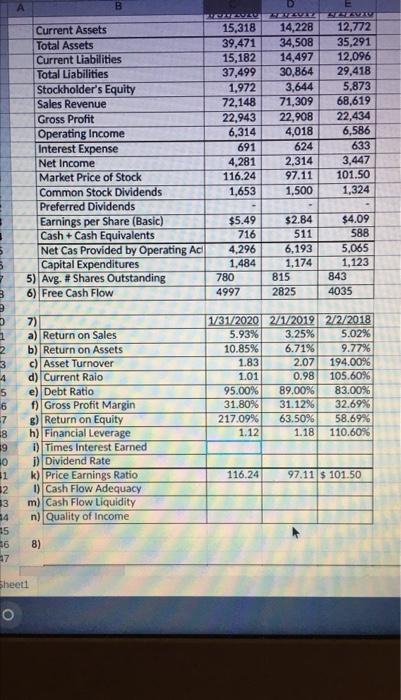
1) 2) 3) 4) Variables for questions 5-11 Current Assets Total Assets Current Liabilities Total Liabilities Stockholder's Equity Sales Revenue Gross Profit Operating Income Interest Expense Net Income Market Price of Stock Common Stock Dividends Preferred Dividends Earnings per Share (Basic) Cash + Cash Equivalents Net Cas Provided by Operating Ac Capital Expenditures 5) Avg. # Shares Outstanding 6) Free Cash Flow 1/31/2020 2/1/2019 2/2/2018 15,318 14,228 12,772 39,471 34,508 35,291 15,182 14,497 12,096 37,499 30,864 29,418 1,972 3,644 5,873 72,148 71,309 68,619 22,943 22,908 22,434 6,314 4,018 6,586 691 624 633 4,281 2,314 3,447 116.24 97.11 101.50 1,653 1,500 1.324 $5.49 716 4,296 1,484 780 4997 $2.84 511 6.193 1,174 815 2825 $4.09 588 5.065 1.123 843 4035 7) a) Return on Sales b) Return on Assets c) Asset Turnover d) Current Raio e) Debt Ratio f) Gross Profit Margin 8) Return on Equity h) Financial Leverage all times. Interest Farned 1/31/2020 2/1/2012 2/2/2018 5.93% 3.25% 5.02% 10.85% 6.71% 9.77% 1.83 2.07 194.00% 1.01 0.98 105.6096 95.00% 89.00% 83.0096 31.80% 31.12% 32.69% 217.09% 63.50% 58.69% 1.12 1.18 110.60% et B Current Assets Total Assets Current Liabilities Total Liabilities Stockholder's Equity Sales Revenue Gross Profit Operating Income Interest Expense Net Income Market Price of Stock Common Stock Dividends Preferred Dividends Earnings per Share (Basic) Cash + Cash Equivalents Net Cas Provided by Operating Ac Capital Expenditures 5) Avg. # Shares Outstanding 6)Free Cash Flow 15,318 39,471 15,182 37,499 1,972 72,148 22,943 6,314 691 4,281 116.24 1,653 TELE 14,228 34,508 14,497 30,864 3,644 71,309 22.908 4,018 624 2.314 97.11 1,500 SESTAVU 12,772 35,291 12,096 29,418 5,873 68,619 22,434 6,586 633 3,447 101.50 1,324 3 5 5 $5.49 716 4,296 1,484 780 4997 $2.84 511 6,193 1.174 815 2825 $4.09 588 5,065 1,123 843 4035 3 9 7) a) Return on Sales b) Return on Assets c) Asset Turnover d) Current Raio e) Debt Ratio f) Gross Profit margin g) Return on Equity h) Financial Leverage i) Times Interest Earned 1) Dividend Rate k) Price Earnings Ratio 0 Cash Flow Adequacy m) Cash Flow Liquidity n) Quality of Income 1/31/2020 271/2012 2/2/2018 5.93% 3.25% 5.02% 10.85% 6.71% 9.77% 1.83 2.07 194.00% 1.01 0.98 105.60% 95.00% 89.00% 83.00% 31.80% 31.1296 32.69% 217.09% 63.50% 58.69% 1.12 1.18 110.60% 2 3 4 5 6 7 8 89 10 11 32 33 34 15 36 27 116.24 97,11 $ 101.50 NonWN 8) Sheet1 o
Step by Step Solution
There are 3 Steps involved in it

Get step-by-step solutions from verified subject matter experts