

Question: Calculate 9A,b,c,d,e, f using chart above 1) 2) 3) 4) aans 3 0 1 2 3 4 15 16 17 18 9 20 21 22
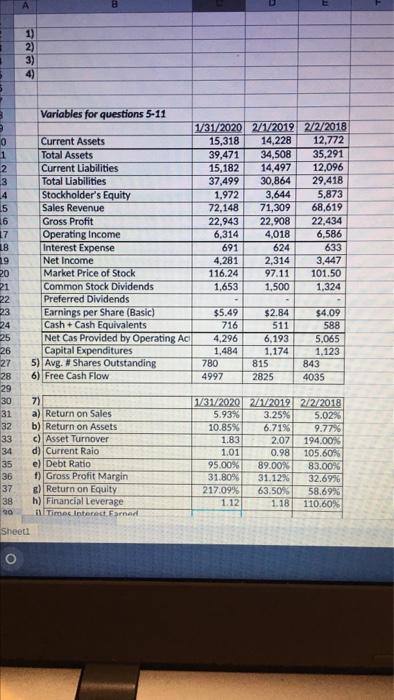
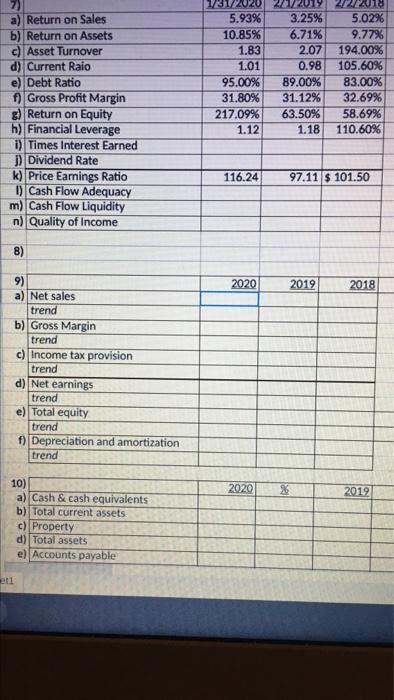
1) 2) 3) 4) aans 3 0 1 2 3 4 15 16 17 18 9 20 21 22 23 24 25 26 27 28 29 30 31 Variables for questions 5-11 1/31/2020 2/1/2019 2/2/2018 Current Assets 15,318 14,228 12,772 Total Assets 39,471 34,508 35,291 Current Liabilities 15,182 14,497 12,096 Total Liabilities 37,499 30,864 29,418 Stockholder's Equity 1.972 3,644 5,873 Sales Revenue 72,148 71,309 68,619 Gross Profit 22,943 22,908 22,434 Operating Income 6,314 4,018 6,586 Interest Expense 691 624 633 Net Income 4.281 2,314 3,447 Market Price of Stock 116.24 97.11 101.50 Common Stock Dividends 1,653 1,500 1.324 Preferred Dividends Earnings per Share (Basic) $5.49 $2.84 $4.09 Cash + Cash Equivalents 716 511 588 Net Cas Provided by Operating AC 4,296 6,193 5.065 Capital Expenditures 1,484 1.174 1.123 5) Avg. # Shares Outstanding 780 815 843 6) Free Cash Flow 4997 2825 4035 32 33 34 7) a) Return on Sales b) Return on Assets c) Asset Turnover d) Current Raio e) Debt Ratio 1) Gross Profit Margin 2) Return on Equity h) Financial Leverage All Time Interest, ornad 1/31/2020 2/1/2012 2/2/2018 5.93% 3.25% 5.02% 10.85% 6.71% 9.77% 1.83 2.07 194.00% 1.01 0.98 105,60% 95.00% 89.00% 83.00% 31.80% 31.12% 32.69% 217.09% 63.50% 58.69% 1.12 1.18 110,60% 35 36 37 38 90 Sheet1 a) Return on Sales Return on Assets Asset Turnover d) Current Raio e) Debt Ratio f) Gross Profit Margin g) Return on Equity h) Financial Leverage i) Times Interest Earned 1) Dividend Rate k) Price Earnings Ratio ) Cash Flow Adequacy m) Cash Flow Liquidity n) Quality of Income 12020 2212201 5.93% 3.25% 10.85% 6.71% 1.83 2.07 1.01 0.98 95.00% 89.00% 31.80% 31.12% 217.09% 63.50% 1.12 1.18 22 2018 5.0296 9.77% 194.00% 105.60% 83.00% 32.69% 58.69% 110.60% 116.24 97.11 $ 101.50 8) 2020 2012 2018 9) a) Net sales trend b) Gross Margin trend c) Income tax provision trend d) Net earnings trend e) Total equity trend f) Depreciation and amortization trend 2029 2012 10) a) Cash & cash equivalents b) Total current assets c) Property d) Total assets e) Accounts payable et1 1) 2) 3) 4) aans 3 0 1 2 3 4 15 16 17 18 9 20 21 22 23 24 25 26 27 28 29 30 31 Variables for questions 5-11 1/31/2020 2/1/2019 2/2/2018 Current Assets 15,318 14,228 12,772 Total Assets 39,471 34,508 35,291 Current Liabilities 15,182 14,497 12,096 Total Liabilities 37,499 30,864 29,418 Stockholder's Equity 1.972 3,644 5,873 Sales Revenue 72,148 71,309 68,619 Gross Profit 22,943 22,908 22,434 Operating Income 6,314 4,018 6,586 Interest Expense 691 624 633 Net Income 4.281 2,314 3,447 Market Price of Stock 116.24 97.11 101.50 Common Stock Dividends 1,653 1,500 1.324 Preferred Dividends Earnings per Share (Basic) $5.49 $2.84 $4.09 Cash + Cash Equivalents 716 511 588 Net Cas Provided by Operating AC 4,296 6,193 5.065 Capital Expenditures 1,484 1.174 1.123 5) Avg. # Shares Outstanding 780 815 843 6) Free Cash Flow 4997 2825 4035 32 33 34 7) a) Return on Sales b) Return on Assets c) Asset Turnover d) Current Raio e) Debt Ratio 1) Gross Profit Margin 2) Return on Equity h) Financial Leverage All Time Interest, ornad 1/31/2020 2/1/2012 2/2/2018 5.93% 3.25% 5.02% 10.85% 6.71% 9.77% 1.83 2.07 194.00% 1.01 0.98 105,60% 95.00% 89.00% 83.00% 31.80% 31.12% 32.69% 217.09% 63.50% 58.69% 1.12 1.18 110,60% 35 36 37 38 90 Sheet1 a) Return on Sales Return on Assets Asset Turnover d) Current Raio e) Debt Ratio f) Gross Profit Margin g) Return on Equity h) Financial Leverage i) Times Interest Earned 1) Dividend Rate k) Price Earnings Ratio ) Cash Flow Adequacy m) Cash Flow Liquidity n) Quality of Income 12020 2212201 5.93% 3.25% 10.85% 6.71% 1.83 2.07 1.01 0.98 95.00% 89.00% 31.80% 31.12% 217.09% 63.50% 1.12 1.18 22 2018 5.0296 9.77% 194.00% 105.60% 83.00% 32.69% 58.69% 110.60% 116.24 97.11 $ 101.50 8) 2020 2012 2018 9) a) Net sales trend b) Gross Margin trend c) Income tax provision trend d) Net earnings trend e) Total equity trend f) Depreciation and amortization trend 2029 2012 10) a) Cash & cash equivalents b) Total current assets c) Property d) Total assets e) Accounts payable et1
Step by Step Solution
There are 3 Steps involved in it

Get step-by-step solutions from verified subject matter experts