

Question: Calculate a 95% condence interval for the true difference between the state MSAunemployment percentages? Assume the variances are equal. Use the information frommy computer output
Calculate a 95% condence interval for the true difference between the state MSAunemployment percentages? Assume the variances are equal. Use the information frommy computer output to show how the upper and lower boundaries of the condence intervalthat were obtained. Interpret the value of the condence interval for the difference in state MSAunemploymmt percentages. What does the condence interval specically tell you about thedifference in State MSA unemployment percentages? ID/Name/ unemployment %26 Enid 13.627 Lawton 16.728 Oklahoma City 7.129 Tulsa 8.9Show wok. Attached is a copy of my SPSS output.
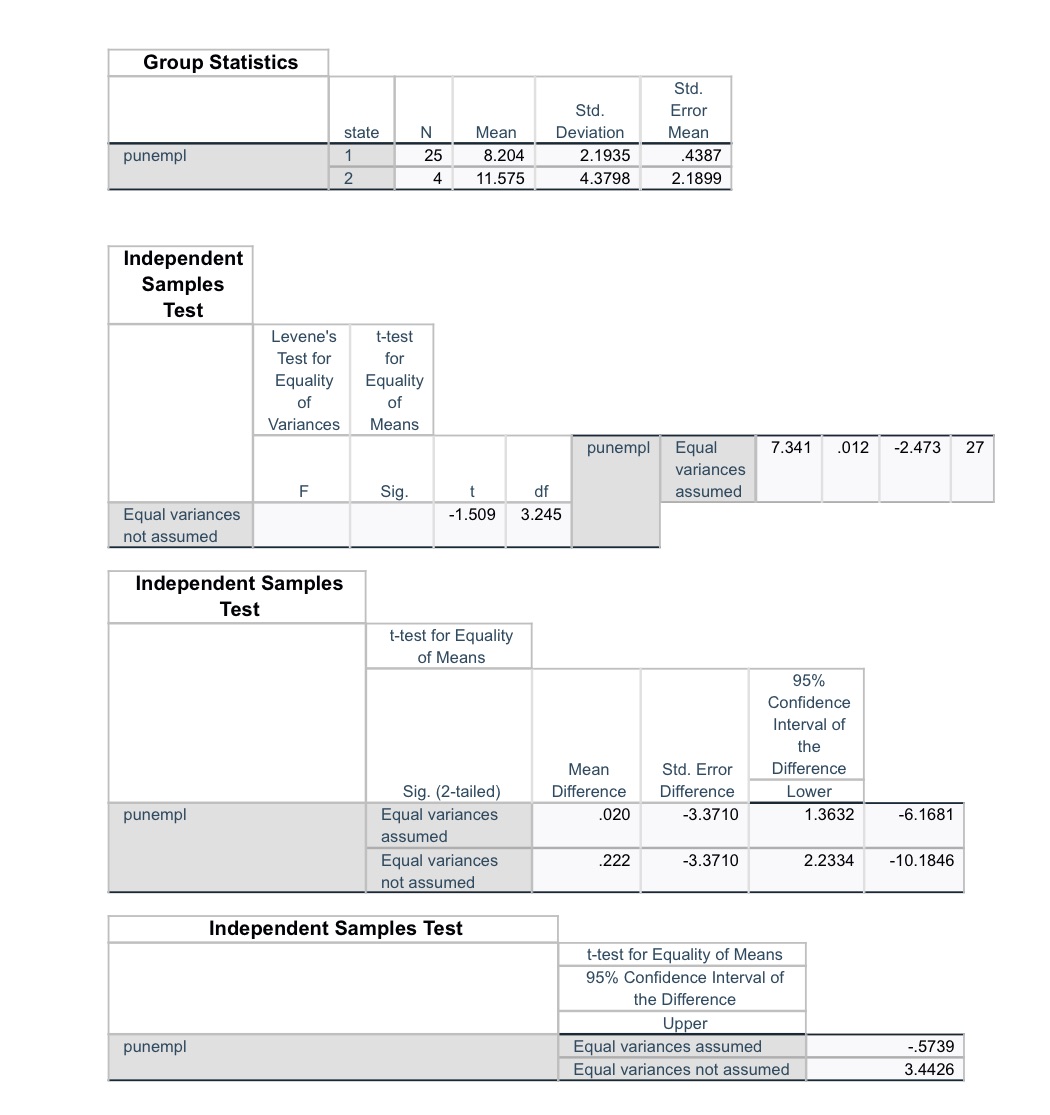
Group Statistics Std. Std. Error state N Mean Deviation Mean punempl 25 8.204 2.1935 4387 2 4 11.575 4.3798 2. 1899 Independent Samples Test Levene's t-test Test for for Equality Equality of of Variances Means punempl Equal 7.341 .012 -2.473 27 variances F Sig. of assumed Equal variances -1.509 3.245 not assumed Independent Samples Test t-test for Equality of Means 15% Confidence Interval of the Mean Std. Error Difference Sig. (2-tailed) Difference Difference Lower punempl Equal variances 020 3.3710 1.3632 -6.1681 assumed Equal variances 222 3.3710 2.2334 -10.1846 not assumed Independent Samples Test t-test for Equality of Means 95% Confidence Interval of the Difference Upper punempl Equal variances assumed .5739 Equal variances not assumed 3.4426
Step by Step Solution
There are 3 Steps involved in it

Get step-by-step solutions from verified subject matter experts