Question: Calculate a forecast using a three period weighted moving average. Use weights of 0.60, 0.30, and 0.10 for the most recent period, the second most
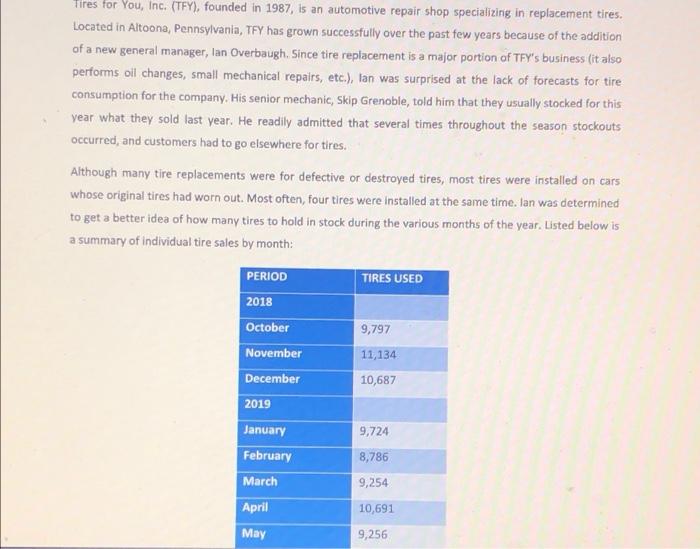
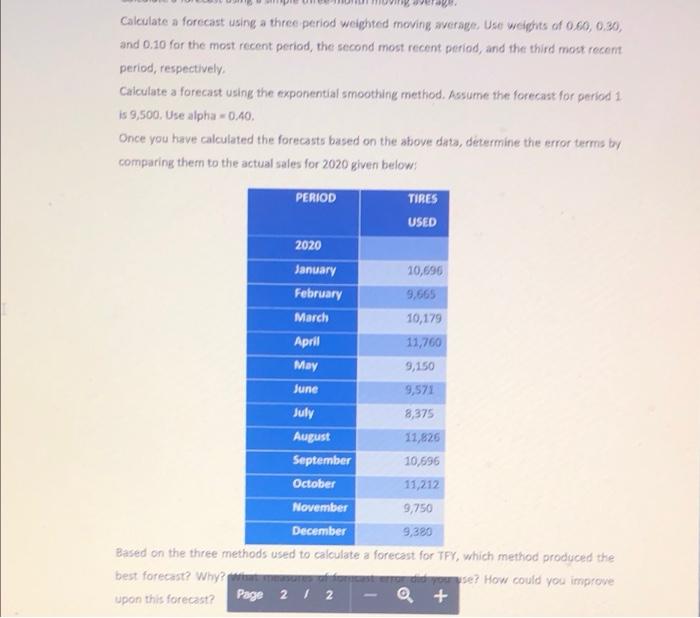
Calculate a forecast using a three period weighted moving average. Use weights of 0.60, 0.30, and 0.10 for the most recent period, the second most recent period, and the third most recent period, respectively. Calculate a forecast using the exponential smoothing method. Assume the forecast for period 1 is 9,500. Use alpha=0.40. Once you have calculated the forecasts based on the above data, dtermine the error terms by comparing them to the actual sales for 2020 given below: PERIOD TIRES USED 2020 January 10,696 February 9,665 March 10,179 April 11,760 May 9,150 June 9,571 July 8,375 August 11,826 September 10,696 October 11,212 November 9,750 December 9,380 Based on the three methods used to calculate a forecast for TFY, which method produced the best forecast? Why? What measures of forcast error d you use? How could you improve upon this forecast? Q+ - Page 2 / 2 Tires for You, Inc. (TFY), founded in 1987, is an automotive repair shop specializing in replacement tires. Located in Altoona, Pennsylvania, TFY has grown successfully over the past few years because of the addition of a new general manager, lan Overbaugh. Since tire replacement is a major portion of TFY's business (it also performs oil changes, small mechanical repairs, etc.), lan was surprised at the lack of forecasts for tire consumption for the company. His senior mechanic, Skip Grenoble, told him that they usually stocked for this year what they sold last year. He readily admitted that several times throughout the season stockouts occurred, and customers had to go elsewhere for tires. Although many tire replacements were for defective or destroyed tires, most tires were installed on cars whose original tires had worn out. Most often, four tires were installed at the same time. Ian was determined to get a better idea of how many tires to hold in stock during the various months of the year. Listed below is a summary of individual tire sales by month: PERIOD TIRES USED 2018 October 9,797 November 11,134 December 10,687 2019 January 9,724 February 8,786 March 9,254 April 10,691 May 9,256