

Question: Calculate (and graph) the return, standard deviation combinations for a portfolio containing only these two companies stocks. At a minimum, you should calculate the two
Calculate (and graph) the return, standard deviation combinations for a portfolio containing only these two companies stocks. At a minimum, you should calculate the two components for 0.5% steps (i.e. 0% WCC/100% RHC, 0.5% WCC/99.5% RHC, ....100% WCC/0% RHC) so that you have 201+ data points. (Hint: you will need to use the return on a portfolio and standard deviation of a two asset portfolio formulas).
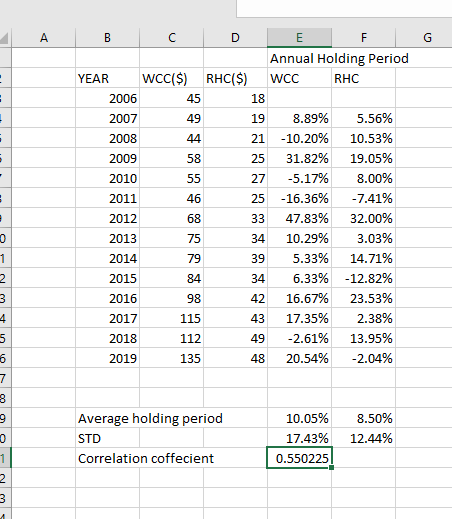
Annual Holding Period YEAR WCC(S) RHC(S)WCC RHC 45 18 19 8.89% 21-10.20% 25 31.82% 27-5.17% 25-16.36% 33 47.83% 34 10.29% 39 5.33% 34 6.33% 42 16.67% 43 17.35% 49-2.61% 48 20.54% 49 2010 2011 2012 2013 2014 2015 2016 2017 2018 2019 5.56% 10.53% 19.05% 8.00% -7.41% 32.00% 3.03% 14.71% -12.82% 23.53% 2.38% 13.95% -2.04% 75 79 84 115 112 135 Average holding period STD 10.05% 17.43% 0.550225 8.50% 12.44% Correlation coffecnt 0550225
Step by Step Solution
There are 3 Steps involved in it

Get step-by-step solutions from verified subject matter experts