

Calculate and Interpret the following financial ratios Current Ratio Quick Ratio Inventory Turn Over Ratio Days...
Fantastic news! We've Found the answer you've been seeking!
Question:
Transcribed Image Text:
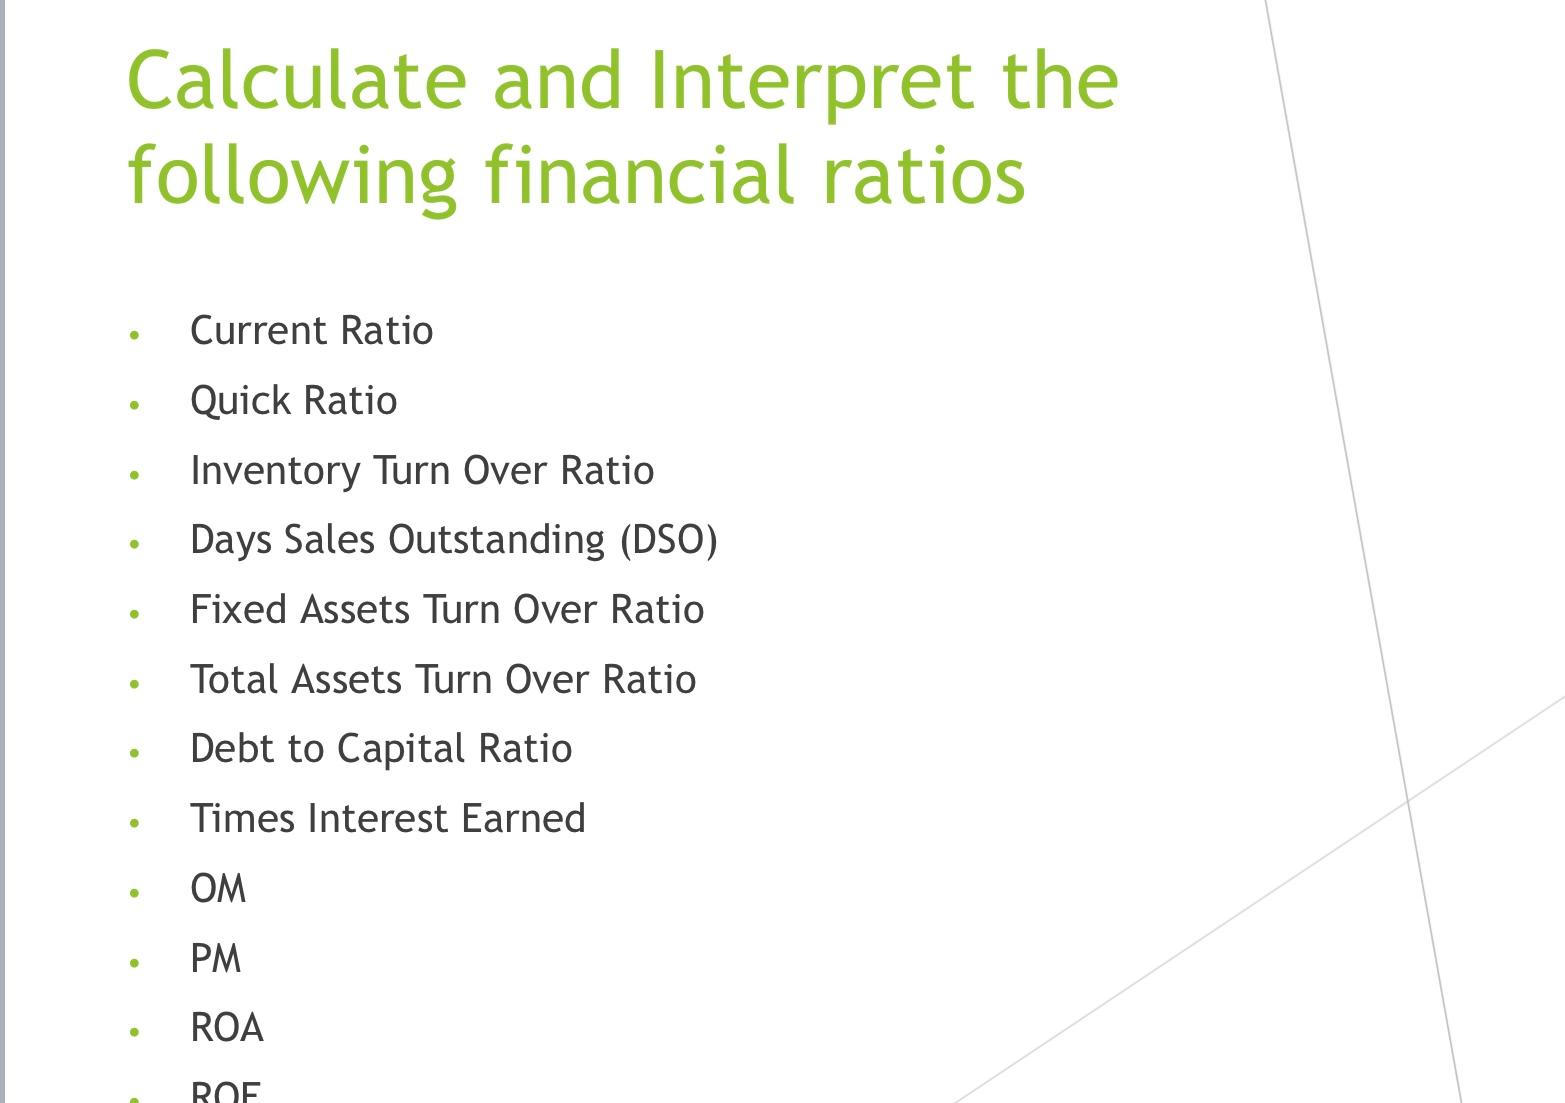
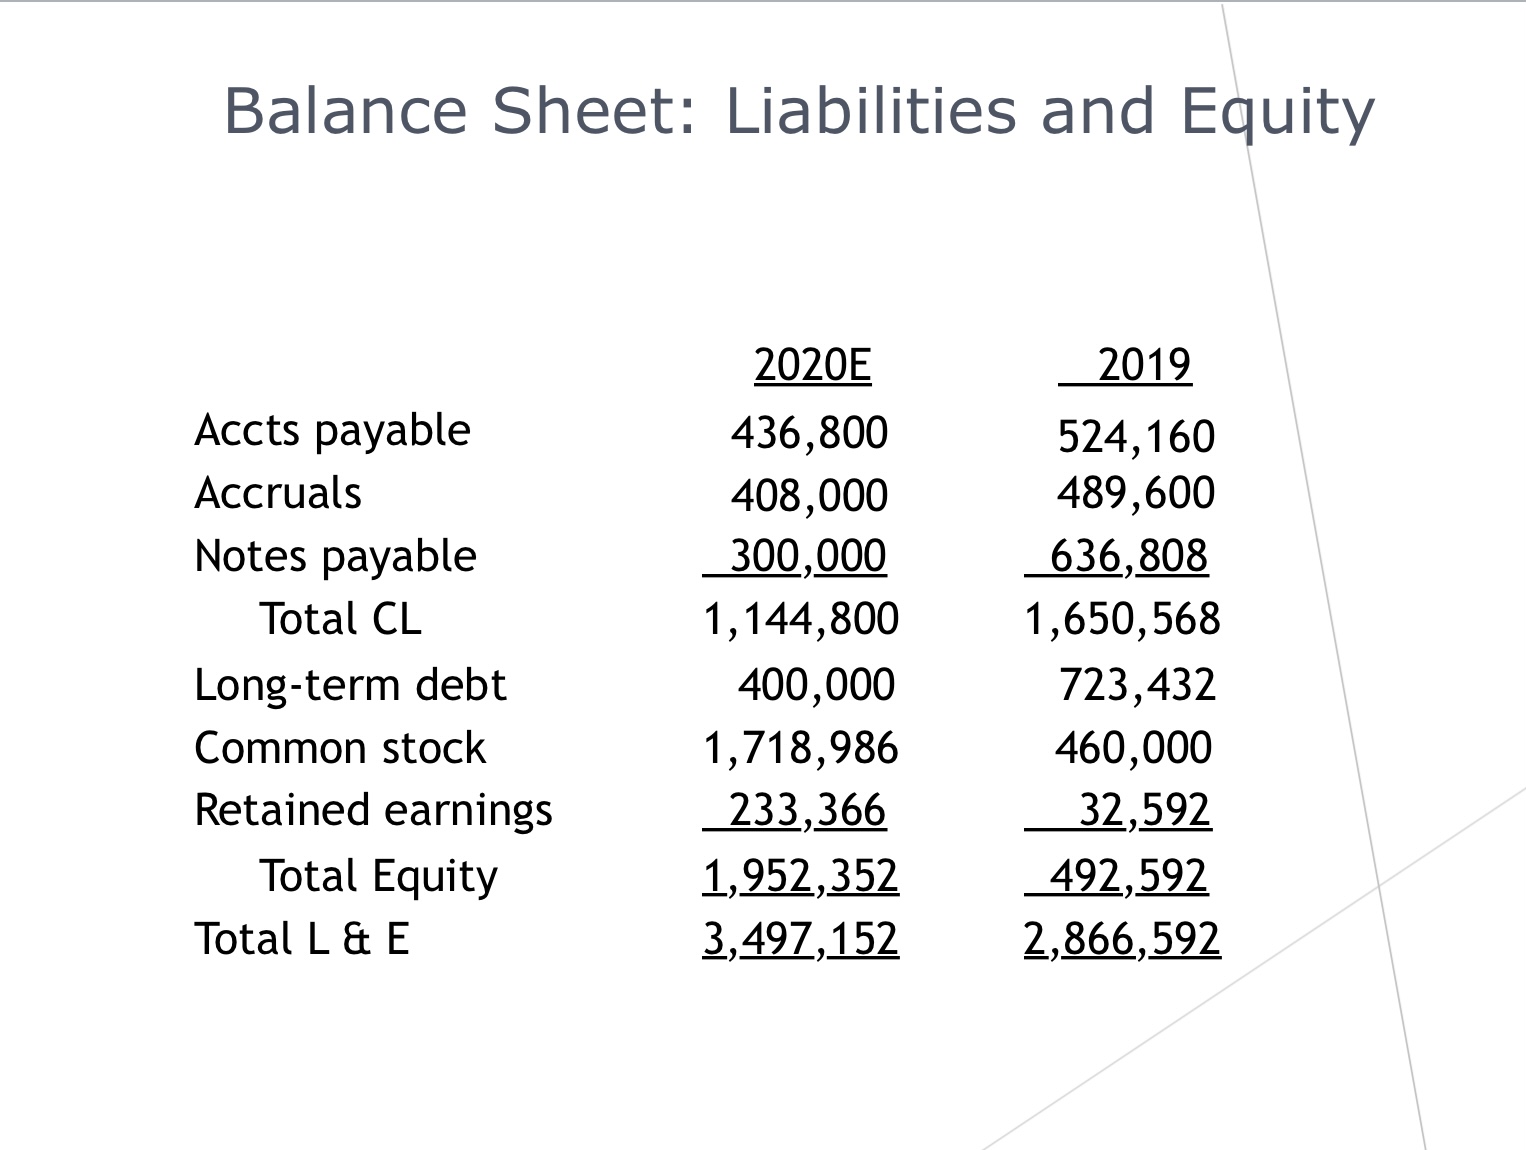
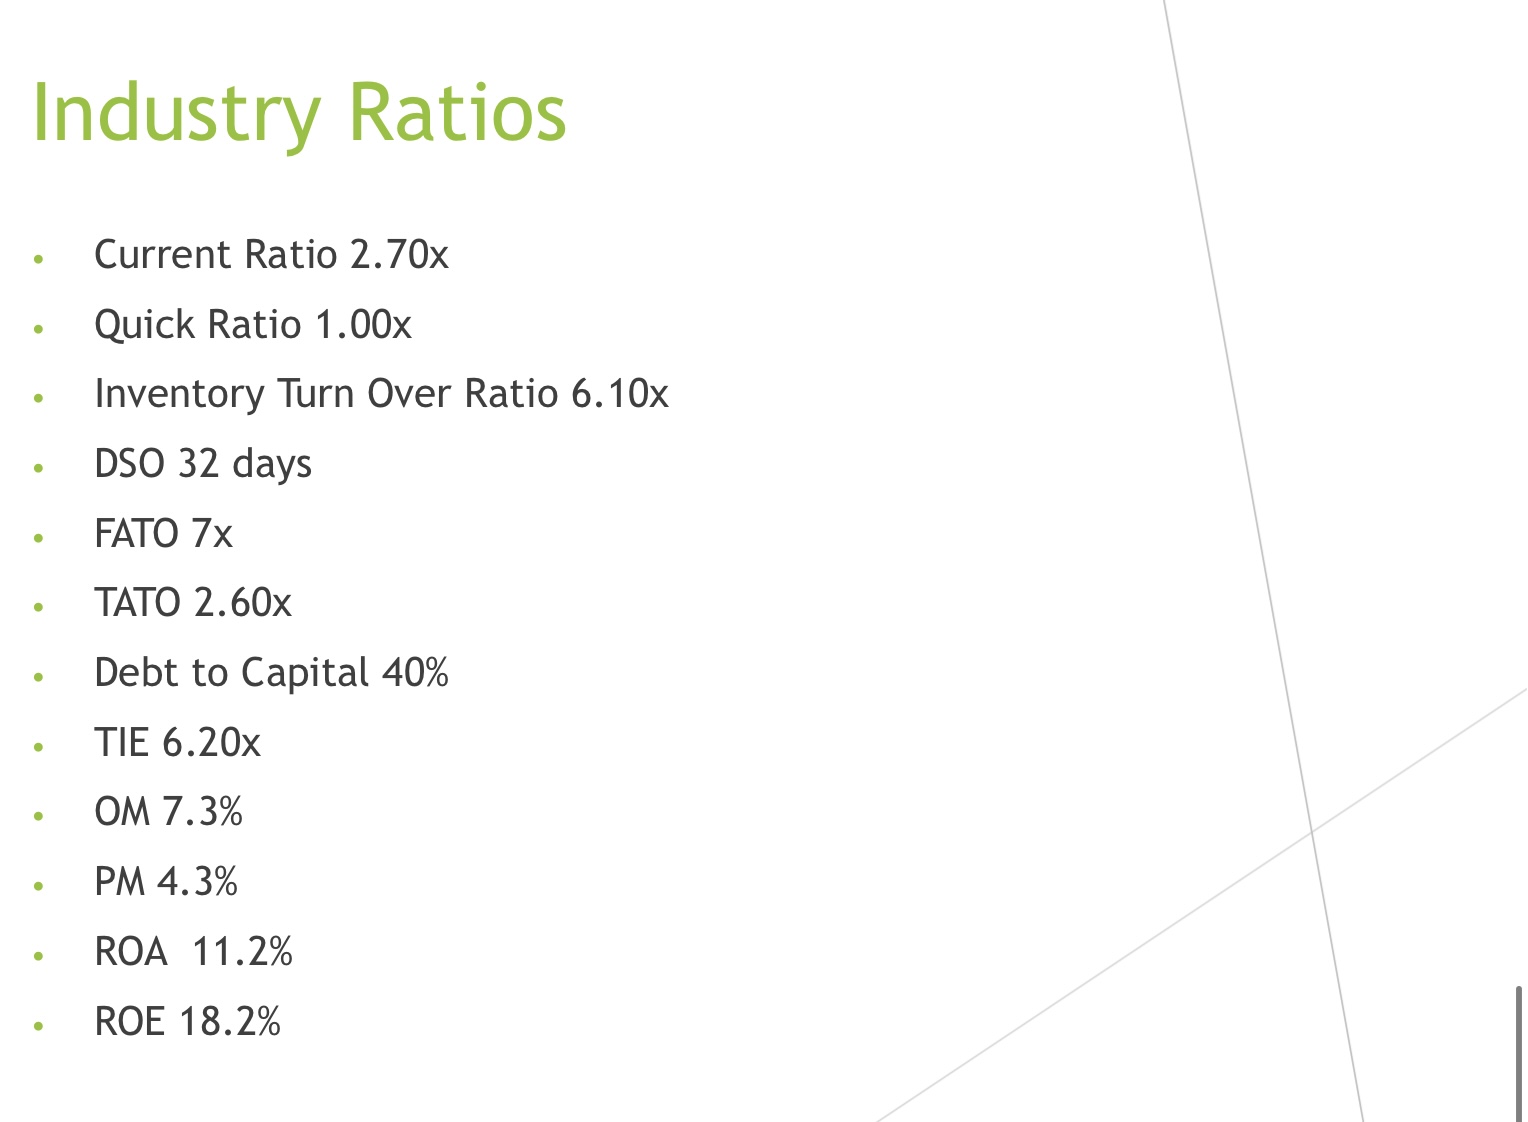
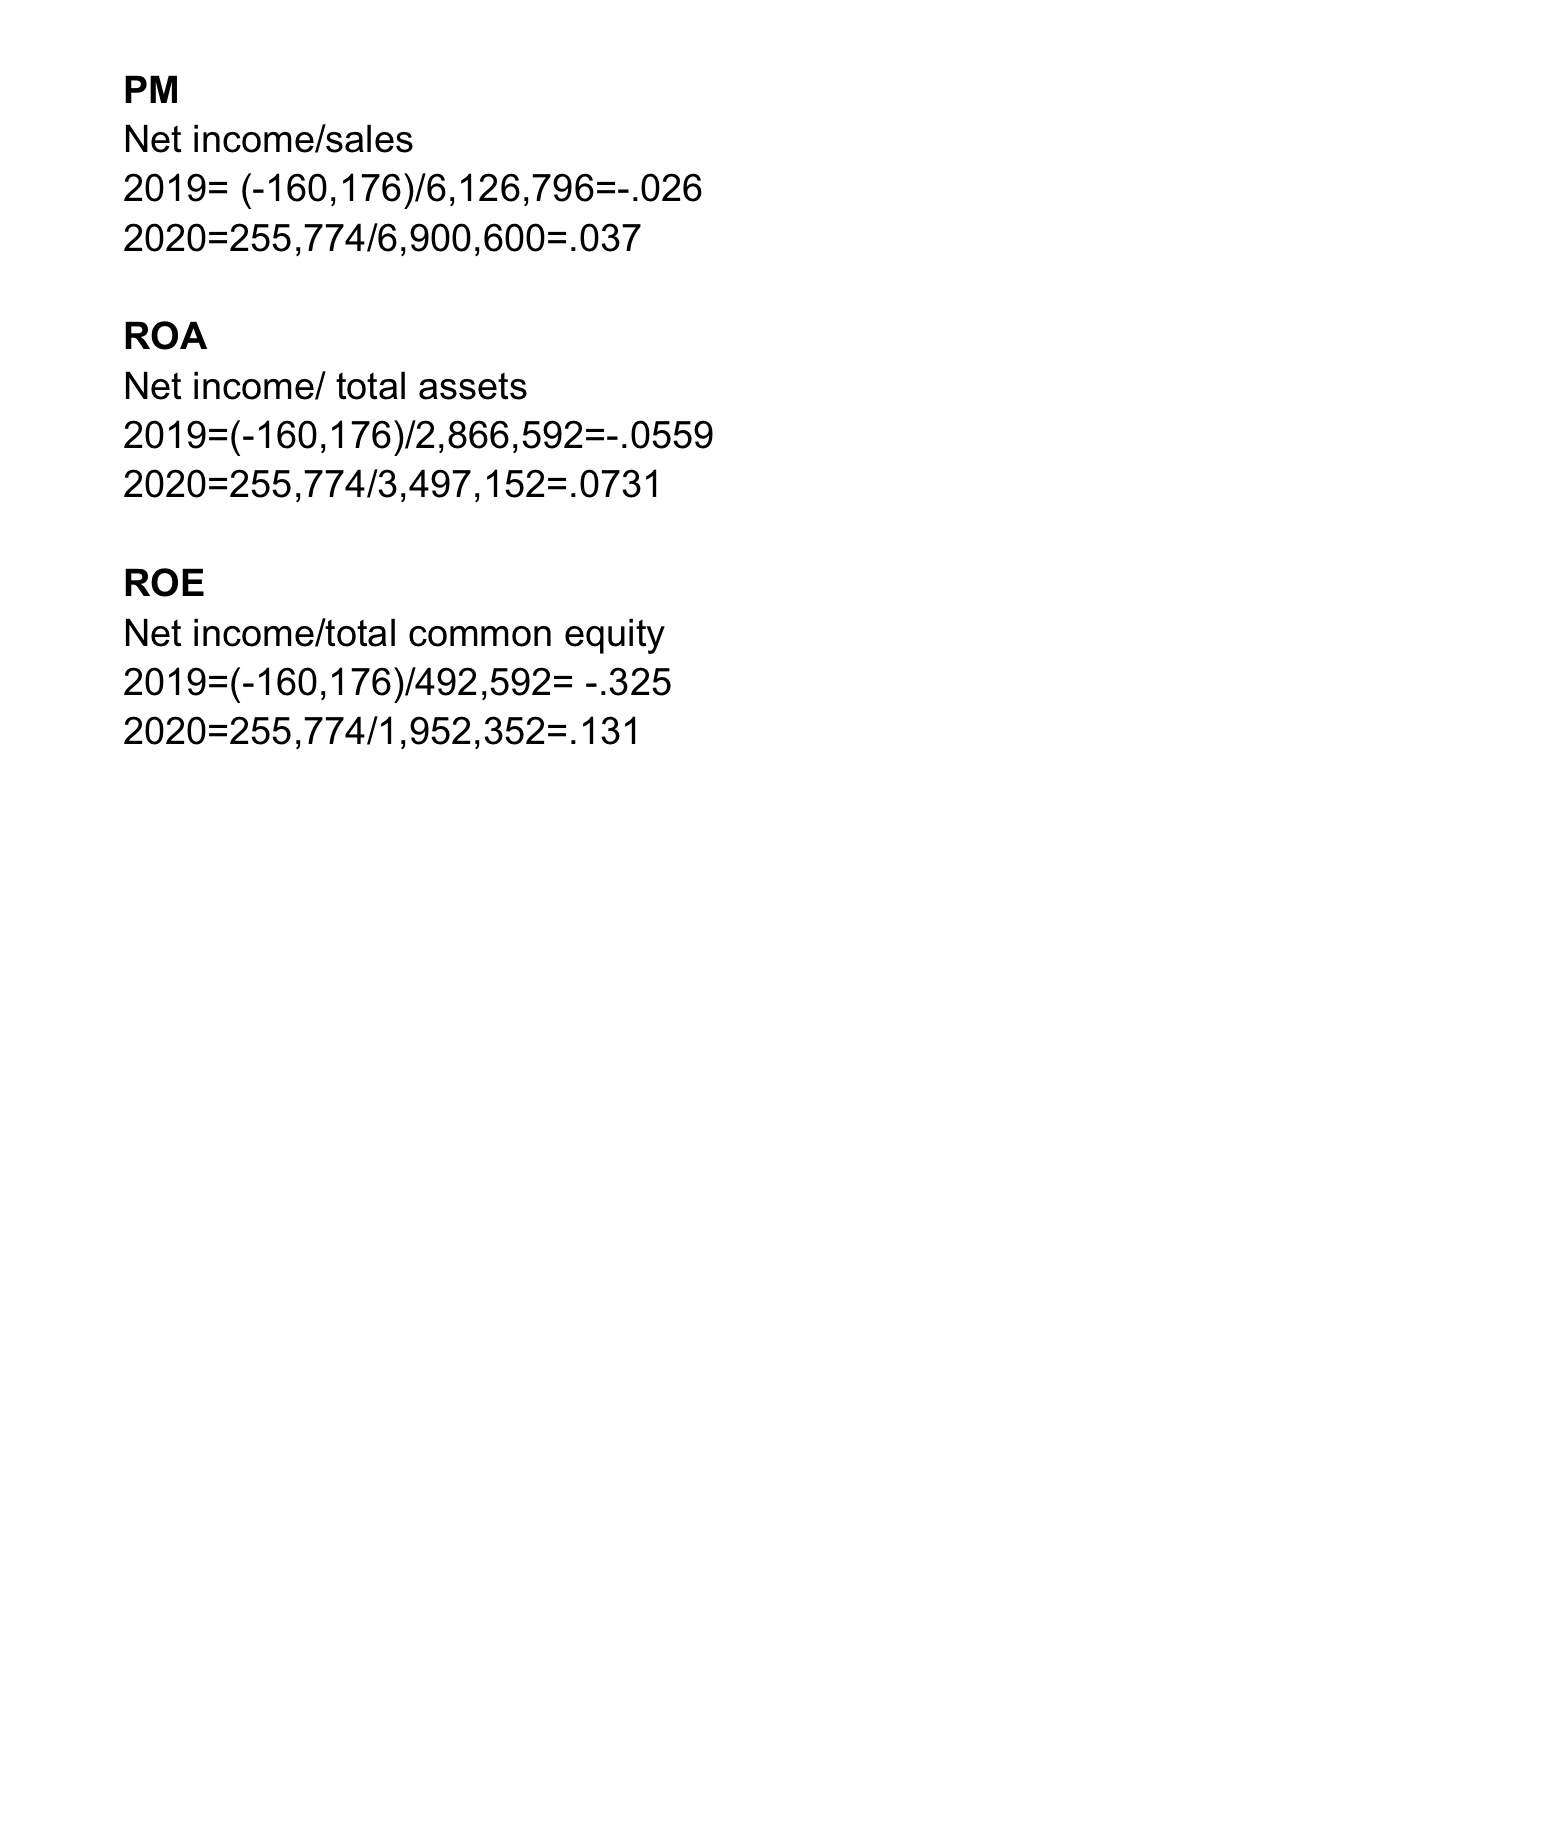
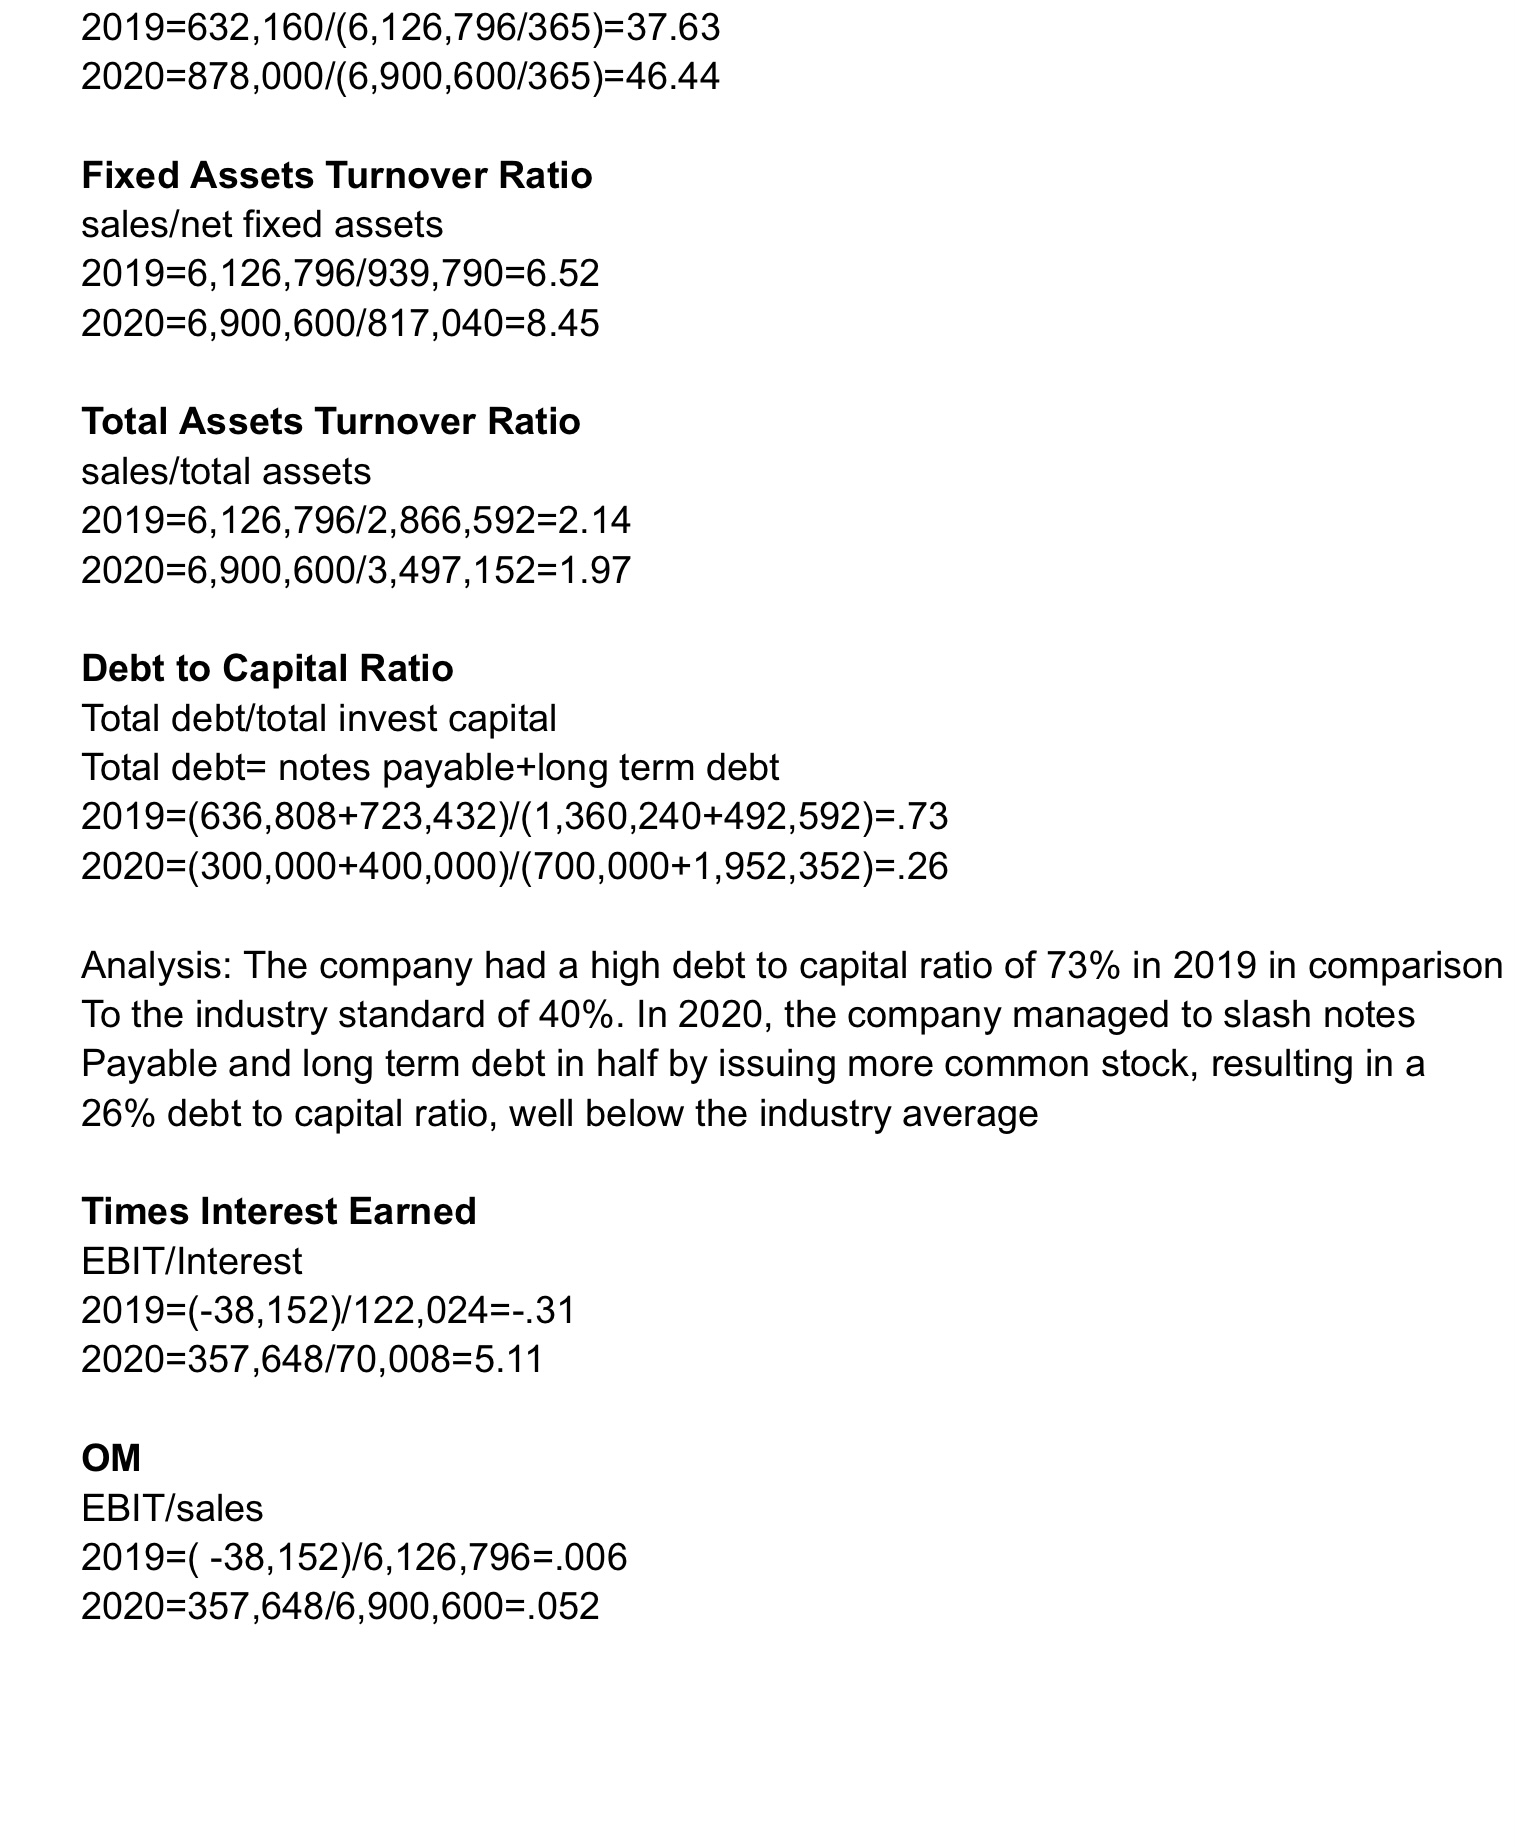
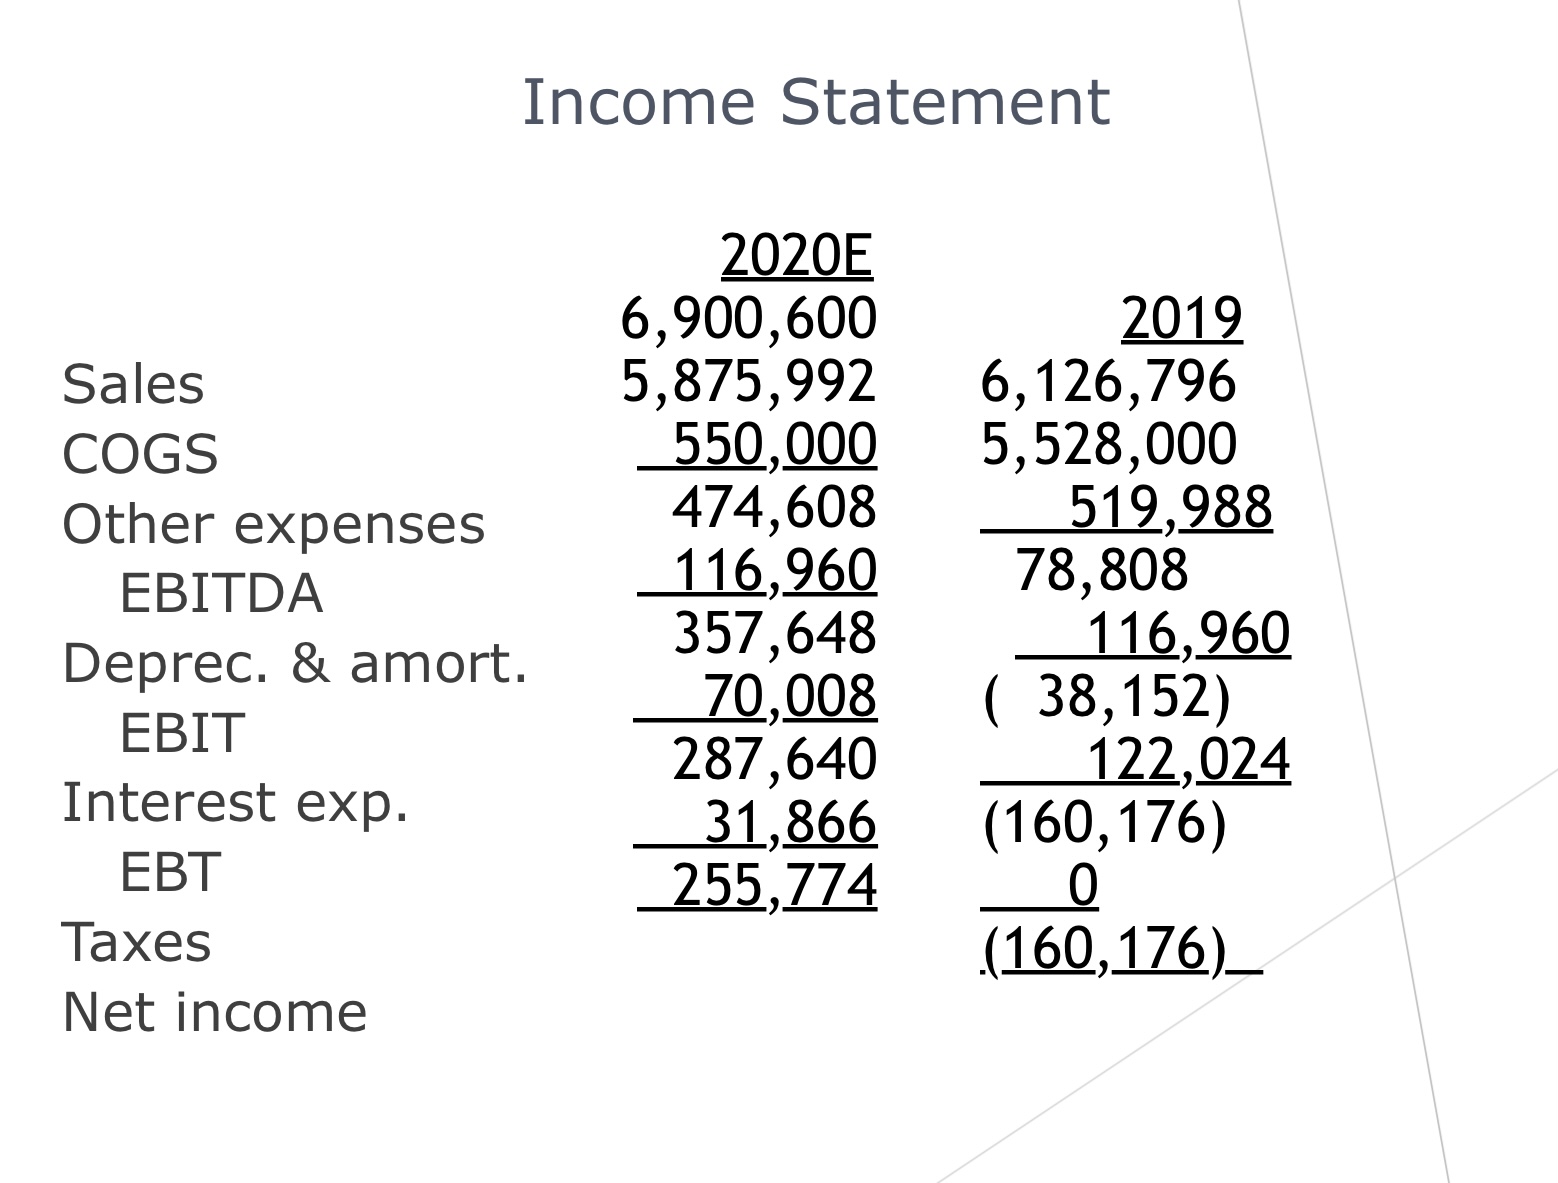
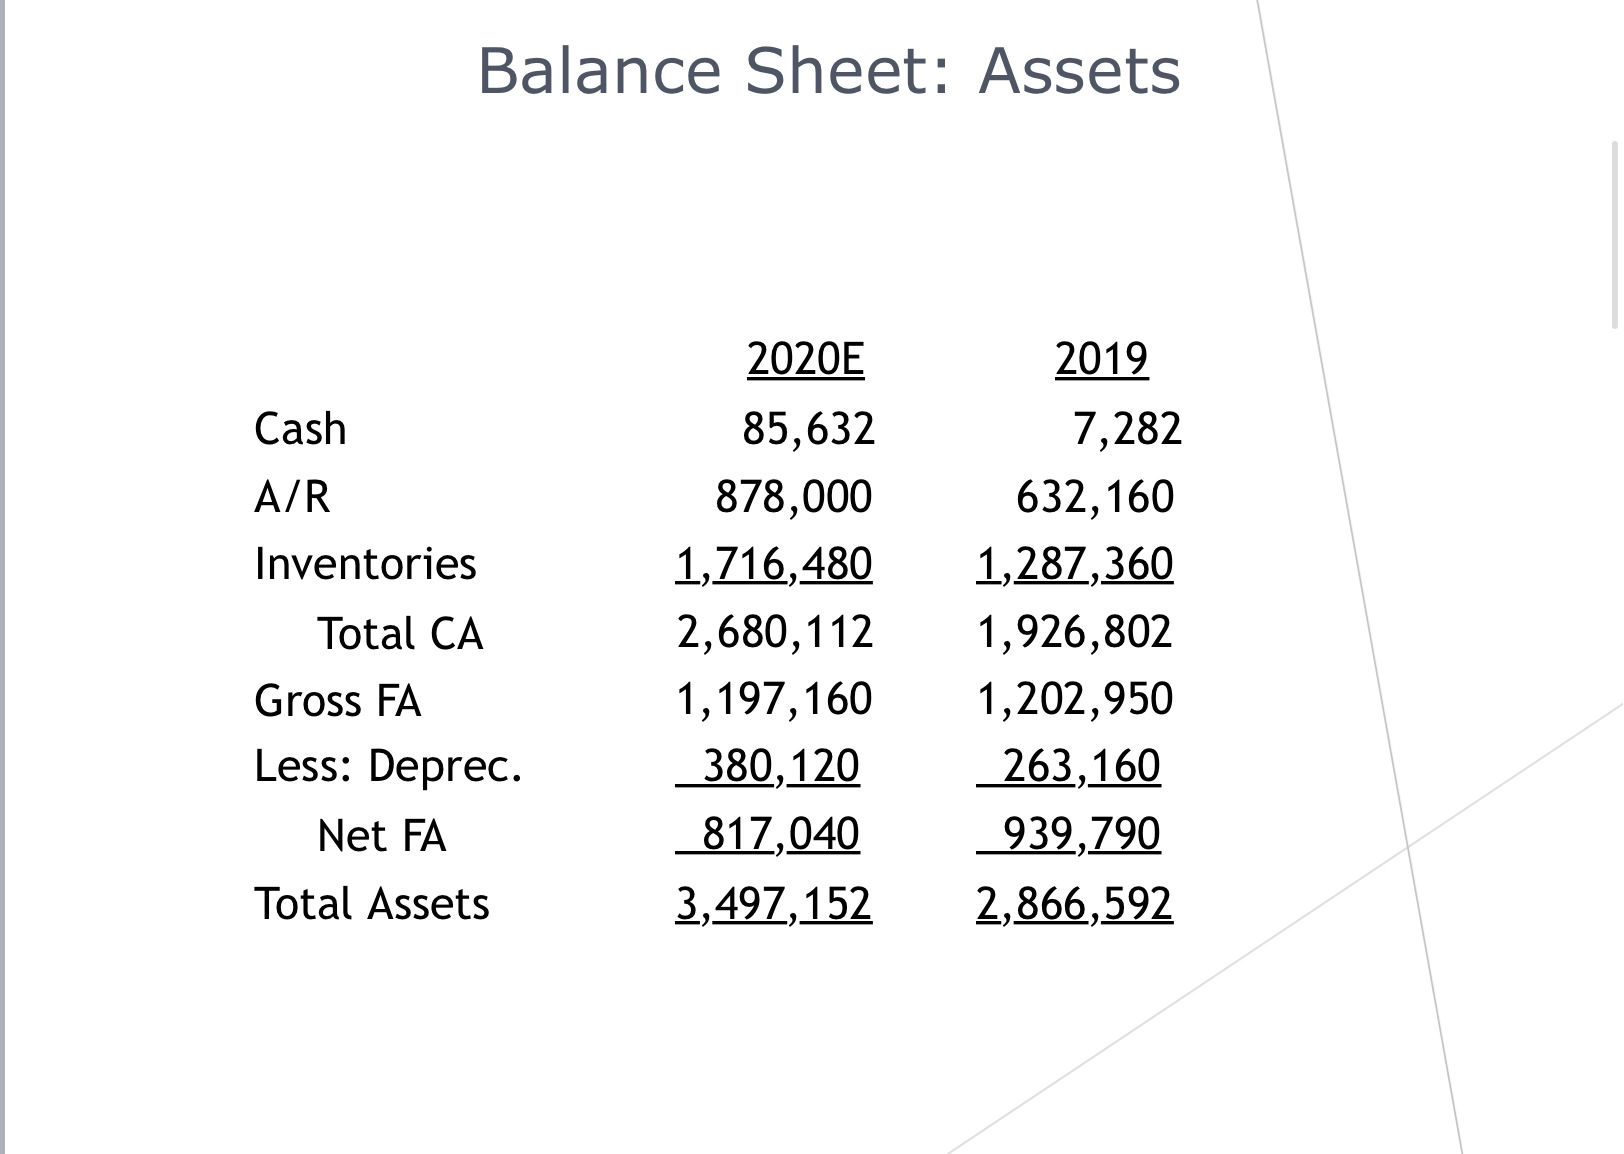
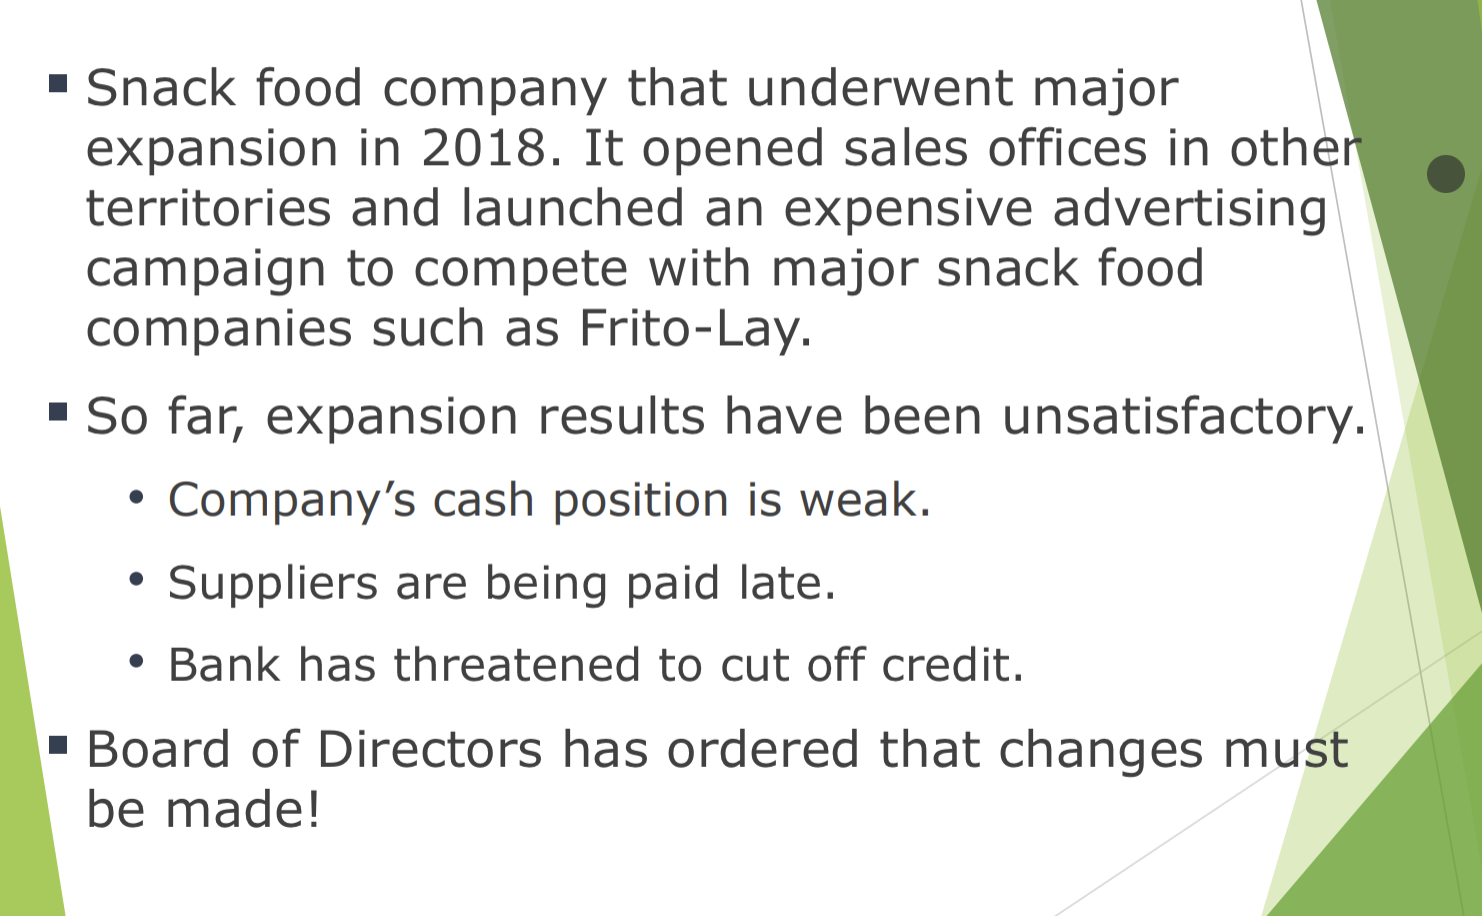
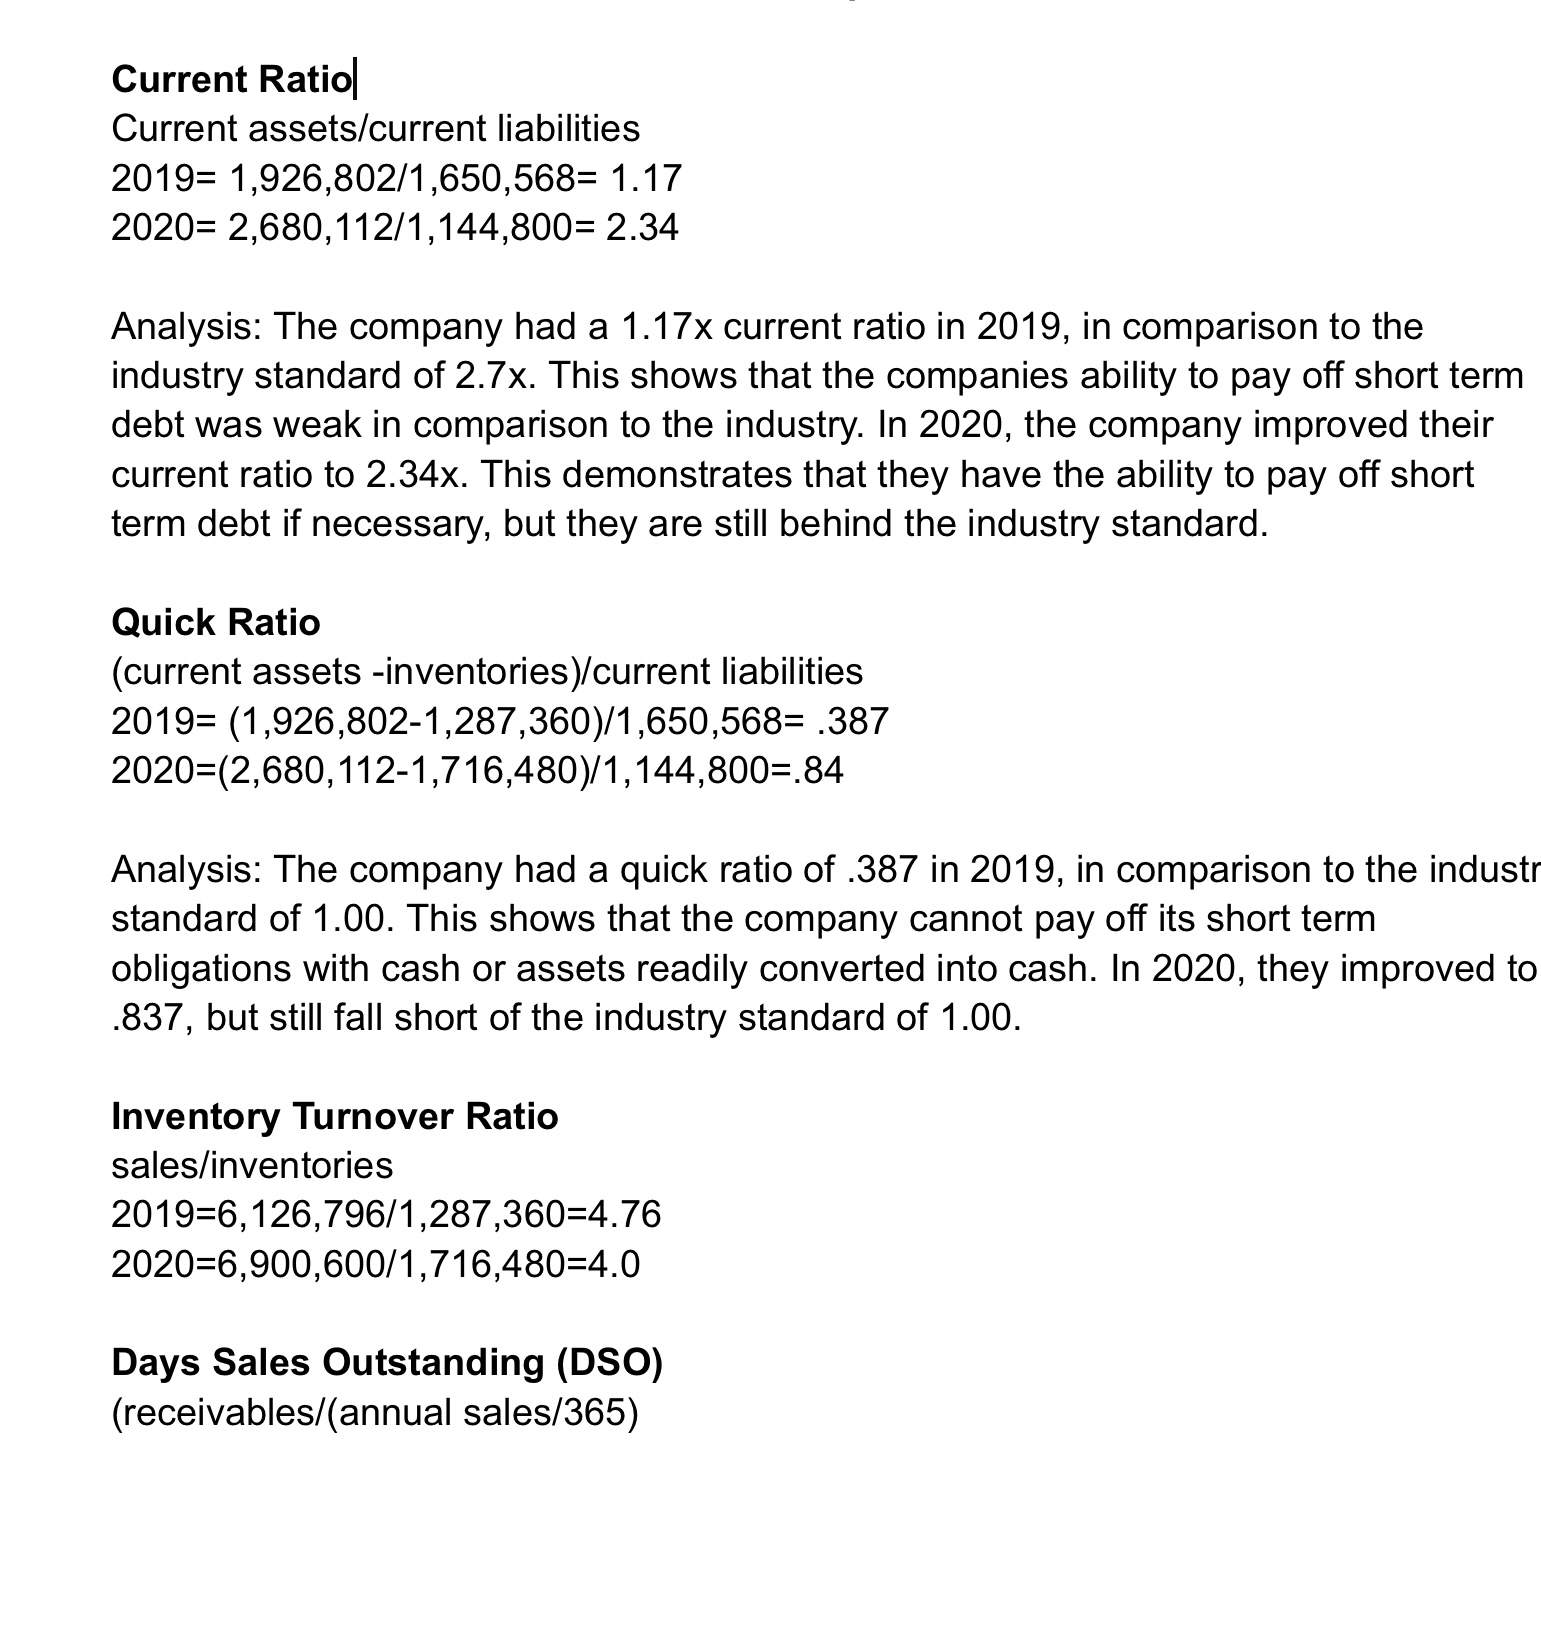
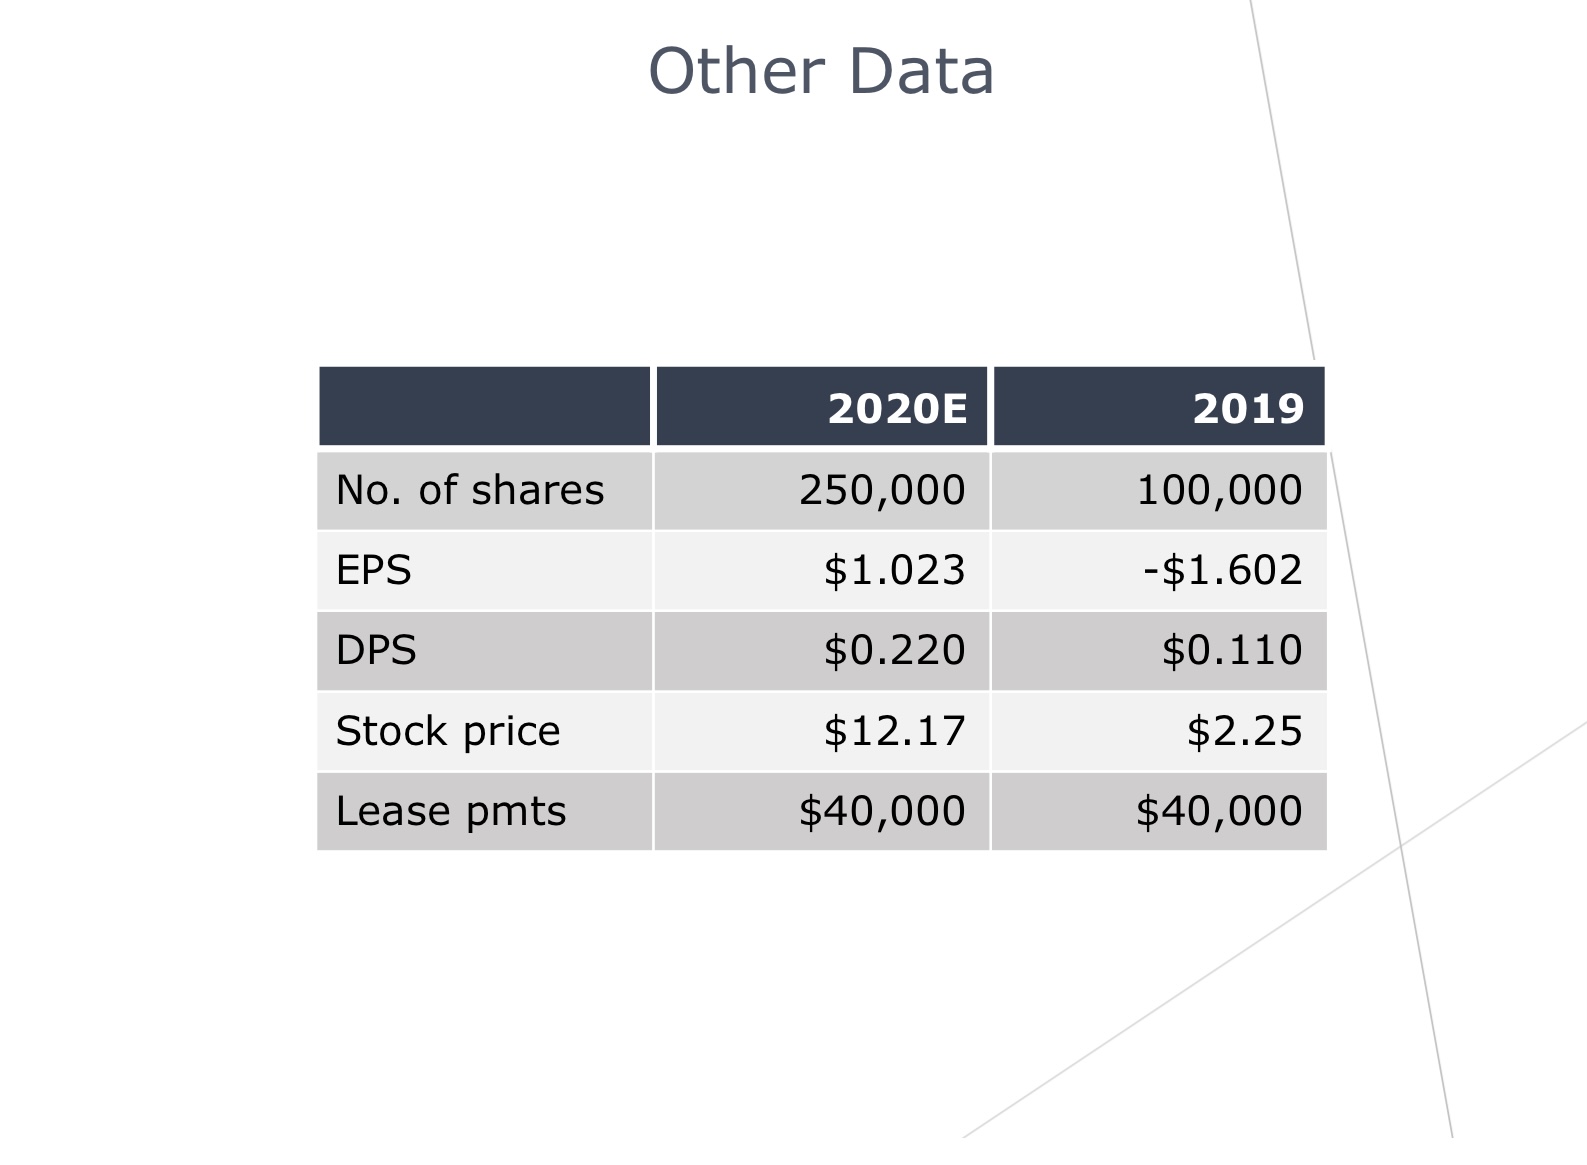
Calculate and Interpret the following financial ratios Current Ratio Quick Ratio Inventory Turn Over Ratio Days Sales Outstanding (DSO) Fixed Assets Turn Over Ratio Total Assets Turn Over Ratio Debt to Capital Ratio Times Interest Earned OM PM ROA ROE Balance Sheet: Liabilities and Equity 2020E 2019 Accts payable 436,800 524,160 Accruals 408,000 489,600 Notes payable 300,000 636,808 Total CL 1,144,800 1,650,568 Long-term debt 400,000 723,432 Common stock 1,718,986 460,000 Retained earnings 233,366 32,592 Total Equity 1,952,352 492,592 Total L & E 3,497,152 2,866,592 Industry Ratios . Current Ratio 2.70x Quick Ratio 1.00x Inventory Turn Over Ratio 6.10x DSO 32 days FATO 7x . TATO 2.60x . Debt to Capital 40% TIE 6.20x OM 7.3% . PM 4.3% ROA 11.2% ROE 18.2% PM Net income/sales 2019= (-160,176)/6,126,796=-.026 2020-255,774/6,900,600=.037 ROA Net income/total assets 2019-(-160,176)/2,866,592=-.0559 2020-255,774/3,497,152=.0731 ROE Net income/total common equity 2019-(-160,176)/492,592= -.325 2020-255,774/1,952,352=.131 2019-632,160/(6,126,796/365)=37.63 2020-878,000/(6,900,600/365)=46.44 Fixed Assets Turnover Ratio sales/net fixed assets 2019-6,126,796/939,790=6.52 2020 6,900,600/817,040-8.45 Total Assets Turnover Ratio sales/total assets 2019-6,126,796/2,866,592=2.14 2020 6,900,600/3,497,152=1.97 Debt to Capital Ratio Total debt/total invest capital Total debt= notes payable+long term debt 2019 (636,808+723,432)/(1,360,240+492,592)=.73 2020 (300,000+400,000)/(700,000+1,952,352)=.26 Analysis: The company had a high debt to capital ratio of 73% in 2019 in comparison To the industry standard of 40%. In 2020, the company managed to slash notes Payable and long term debt in half by issuing more common stock, resulting in a 26% debt to capital ratio, well below the industry average Times Interest Earned EBIT/Interest 2019 (-38,152)/122,024=-.31 2020=357,648/70,008=5.11 OM EBIT/sales 2019 (-38,152)/6,126,796=.006 2020=357,648/6,900,600=.052 Income Statement 2020E 6,900,600 2019 Sales 5,875,992 6,126,796 COGS 550,000 5,528,000 Other expenses 474,608 519,988 EBITDA 116,960 78,808 357,648 116,960 Deprec. & amort. 70,008 ( 38,152) EBIT 287,640 122,024 Interest exp. 31,866 (160,176) EBT 255,774 0 Taxes (160,176) Net income Balance Sheet: Assets 2020E 2019 Cash 85,632 7,282 A/R 878,000 632,160 Inventories 1,716,480 1,287,360 Total CA 2,680,112 1,926,802 Gross FA 1,197,160 1,202,950 Less: Deprec. 380,120 263,160 Net FA 817,040 939,790 Total Assets 3,497,152 2,866,592 Snack food company that underwent major expansion in 2018. It opened sales offices in other territories and launched an expensive advertising campaign to compete with major snack food companies such as Frito-Lay. So far, expansion results have been unsatisfactory. Company's cash position is weak. Suppliers are being paid late. Bank has threatened to cut off credit. Board of Directors has ordered that changes must be made! Current Ratio Current assets/current liabilities 2019 1,926,802/1,650,568= 1.17 2020 2,680,112/1,144,800= 2.34 Analysis: The company had a 1.17x current ratio in 2019, in comparison to the industry standard of 2.7x. This shows that the companies ability to pay off short term debt was weak in comparison to the industry. In 2020, the company improved their current ratio to 2.34x. This demonstrates that they have the ability to pay off short term debt if necessary, but they are still behind the industry standard. Quick Ratio (current assets -inventories)/current liabilities 2019= (1,926,802-1,287,360)/1,650,568= .387 2020=(2,680,112-1,716,480)/1,144,800=.84 Analysis: The company had a quick ratio of .387 in 2019, in comparison to the industr standard of 1.00. This shows that the company cannot pay off its short term obligations with cash or assets readily converted into cash. In 2020, they improved to .837, but still fall short of the industry standard of 1.00. Inventory Turnover Ratio sales/inventories 2019 6,126,796/1,287,360=4.76 2020 6,900,600/1,716,480=4.0 Days Sales Outstanding (DSO) (receivables/(annual sales/365) Other Data 2020E 2019 No. of shares 250,000 100,000 EPS $1.023 -$1.602 DPS $0.220 $0.110 Stock price $12.17 $2.25 Lease pmts $40,000 $40,000 Calculate and Interpret the following financial ratios Current Ratio Quick Ratio Inventory Turn Over Ratio Days Sales Outstanding (DSO) Fixed Assets Turn Over Ratio Total Assets Turn Over Ratio Debt to Capital Ratio Times Interest Earned OM PM ROA ROE Balance Sheet: Liabilities and Equity 2020E 2019 Accts payable 436,800 524,160 Accruals 408,000 489,600 Notes payable 300,000 636,808 Total CL 1,144,800 1,650,568 Long-term debt 400,000 723,432 Common stock 1,718,986 460,000 Retained earnings 233,366 32,592 Total Equity 1,952,352 492,592 Total L & E 3,497,152 2,866,592 Industry Ratios . Current Ratio 2.70x Quick Ratio 1.00x Inventory Turn Over Ratio 6.10x DSO 32 days FATO 7x . TATO 2.60x . Debt to Capital 40% TIE 6.20x OM 7.3% . PM 4.3% ROA 11.2% ROE 18.2% PM Net income/sales 2019= (-160,176)/6,126,796=-.026 2020-255,774/6,900,600=.037 ROA Net income/total assets 2019-(-160,176)/2,866,592=-.0559 2020-255,774/3,497,152=.0731 ROE Net income/total common equity 2019-(-160,176)/492,592= -.325 2020-255,774/1,952,352=.131 2019-632,160/(6,126,796/365)=37.63 2020-878,000/(6,900,600/365)=46.44 Fixed Assets Turnover Ratio sales/net fixed assets 2019-6,126,796/939,790=6.52 2020 6,900,600/817,040-8.45 Total Assets Turnover Ratio sales/total assets 2019-6,126,796/2,866,592=2.14 2020 6,900,600/3,497,152=1.97 Debt to Capital Ratio Total debt/total invest capital Total debt= notes payable+long term debt 2019 (636,808+723,432)/(1,360,240+492,592)=.73 2020 (300,000+400,000)/(700,000+1,952,352)=.26 Analysis: The company had a high debt to capital ratio of 73% in 2019 in comparison To the industry standard of 40%. In 2020, the company managed to slash notes Payable and long term debt in half by issuing more common stock, resulting in a 26% debt to capital ratio, well below the industry average Times Interest Earned EBIT/Interest 2019 (-38,152)/122,024=-.31 2020=357,648/70,008=5.11 OM EBIT/sales 2019 (-38,152)/6,126,796=.006 2020=357,648/6,900,600=.052 Income Statement 2020E 6,900,600 2019 Sales 5,875,992 6,126,796 COGS 550,000 5,528,000 Other expenses 474,608 519,988 EBITDA 116,960 78,808 357,648 116,960 Deprec. & amort. 70,008 ( 38,152) EBIT 287,640 122,024 Interest exp. 31,866 (160,176) EBT 255,774 0 Taxes (160,176) Net income Balance Sheet: Assets 2020E 2019 Cash 85,632 7,282 A/R 878,000 632,160 Inventories 1,716,480 1,287,360 Total CA 2,680,112 1,926,802 Gross FA 1,197,160 1,202,950 Less: Deprec. 380,120 263,160 Net FA 817,040 939,790 Total Assets 3,497,152 2,866,592 Snack food company that underwent major expansion in 2018. It opened sales offices in other territories and launched an expensive advertising campaign to compete with major snack food companies such as Frito-Lay. So far, expansion results have been unsatisfactory. Company's cash position is weak. Suppliers are being paid late. Bank has threatened to cut off credit. Board of Directors has ordered that changes must be made! Current Ratio Current assets/current liabilities 2019 1,926,802/1,650,568= 1.17 2020 2,680,112/1,144,800= 2.34 Analysis: The company had a 1.17x current ratio in 2019, in comparison to the industry standard of 2.7x. This shows that the companies ability to pay off short term debt was weak in comparison to the industry. In 2020, the company improved their current ratio to 2.34x. This demonstrates that they have the ability to pay off short term debt if necessary, but they are still behind the industry standard. Quick Ratio (current assets -inventories)/current liabilities 2019= (1,926,802-1,287,360)/1,650,568= .387 2020=(2,680,112-1,716,480)/1,144,800=.84 Analysis: The company had a quick ratio of .387 in 2019, in comparison to the industr standard of 1.00. This shows that the company cannot pay off its short term obligations with cash or assets readily converted into cash. In 2020, they improved to .837, but still fall short of the industry standard of 1.00. Inventory Turnover Ratio sales/inventories 2019 6,126,796/1,287,360=4.76 2020 6,900,600/1,716,480=4.0 Days Sales Outstanding (DSO) (receivables/(annual sales/365) Other Data 2020E 2019 No. of shares 250,000 100,000 EPS $1.023 -$1.602 DPS $0.220 $0.110 Stock price $12.17 $2.25 Lease pmts $40,000 $40,000
Expert Answer:

Related Book For 
Posted Date:
Students also viewed these finance questions
-
A paper recycling company converts newspaper, mixed paper, white office paper, and cardboard into pulp for newsprint, packaging paper, and print stock quality paper. The following table summarizes...
-
The estimated pre-IPO value of equity in the company is about 63 million and there are 4 million shares of existing shares of stock held by family members. The investment bank will charge a 7%...
-
Hudson Co. reports the contribution margin income statement for 2019 below. Using this information, compute HudsonCo.s (1) Break-even point in units (2) Break-even point in sales dollars....
-
Based on the design, briefly discuss the data collection procedures to be used. Be sure to include the area rea of focus and targeted sample as part of these procedures. Develop a hypothetical...
-
WoodGrain Technology makes home office furniture from fi ne hardwoods. The company uses a joborder costing system and predetermined overhead rates to apply manufacturing overhead cost to jobs. The...
-
Explain why not all relationships go through every stage in Knapp's Relational Model. Give an example.
-
Follow the instructions to answer the following: Choose a global destination and research how your destination has mitigated the effects of global climate change. Mitigation can be considered the...
-
Mr. sailor funded the brokerage account with $100,000 and purchased 30 yr. t-strip in march 1987, by end of march, i.r. = 8% Account balance is now about ____ ? In 2006, investor purchased 30yr zero...
-
Jake takes out a $10,000 loan. Later, Jake becomes unable to pay off the loan when the loan balance is $4,000. So, the lender makes a decision to cancel (forgive) the remaining balance on the loan....
-
7. The point (3, 81) is on the graph of the function y = x. a) Find the corresponding coordinates of this point on the graph f(x) = (2x+10)-2. [2K] b) Describe the transformations that must be...
-
Solve the equation. log () x = -3
-
Christophers Custom Cabinet Company uses a job order cost system with overhead applied as a percentage of direct labor costs. Inventory balances at the beginning of 2016 follow: Raw Materials...
-
Calculate the value of n j in which an oxygen atom confined to a cubical box 1cm on each side will have same energy as the lowest energy available to a helium atom confined to a cubical box 210 10 m...
-
When the Department of Homeland Security created a color-coded system to prepare government officials and the public against terrorist attacks, what did it do right and what did it do wrong?
-
Refer back to Problem 14-15. Assume that Ybors management is considering a change in the firms capital structure to include more debt. Management would therefore like to analyze the effects of an...
-
Marty Kimble, who retired many years ago after winning a huge lottery jackpot, wants to start a new company that will sell authentic sports memorabilia. He plans to name the company Pro Athlete...
-
Following is information about the Super Shoe Store (SSS): Selling price per unit ........ $ 50 Variable cost per unit ........ $ 30 Fixed operating costs ........ $120,000 a. What is SSSs operating...
-
This question is an extension of Exercise 10.22. Consider the data file \(m r o z\) on working wives and the model \(\ln (W A G E)=\beta_{1}+\beta_{2} E D U C+\beta_{3} E X P E R+e\). Use the 428...
-
Consider the data file \(m r o z\) on working wives. Use the 428 observations on married women who participate in the labor force. In this exercise, we examine the effectiveness of alternative...
-
To examine the quantity theory of money, Brumm (2005) ["Money Growth, Output Growth, and Inflation: A Reexamination of the Modern Quantity Theory's Linchpin Prediction," Southern Economic Journal,...

Study smarter with the SolutionInn App