

Question: Calculate B and C please portfolio B, standard deviation actually falls. As we've seen, this is the benefit of diversification. TABLE 11.9 Risk and return
Calculate B and C please
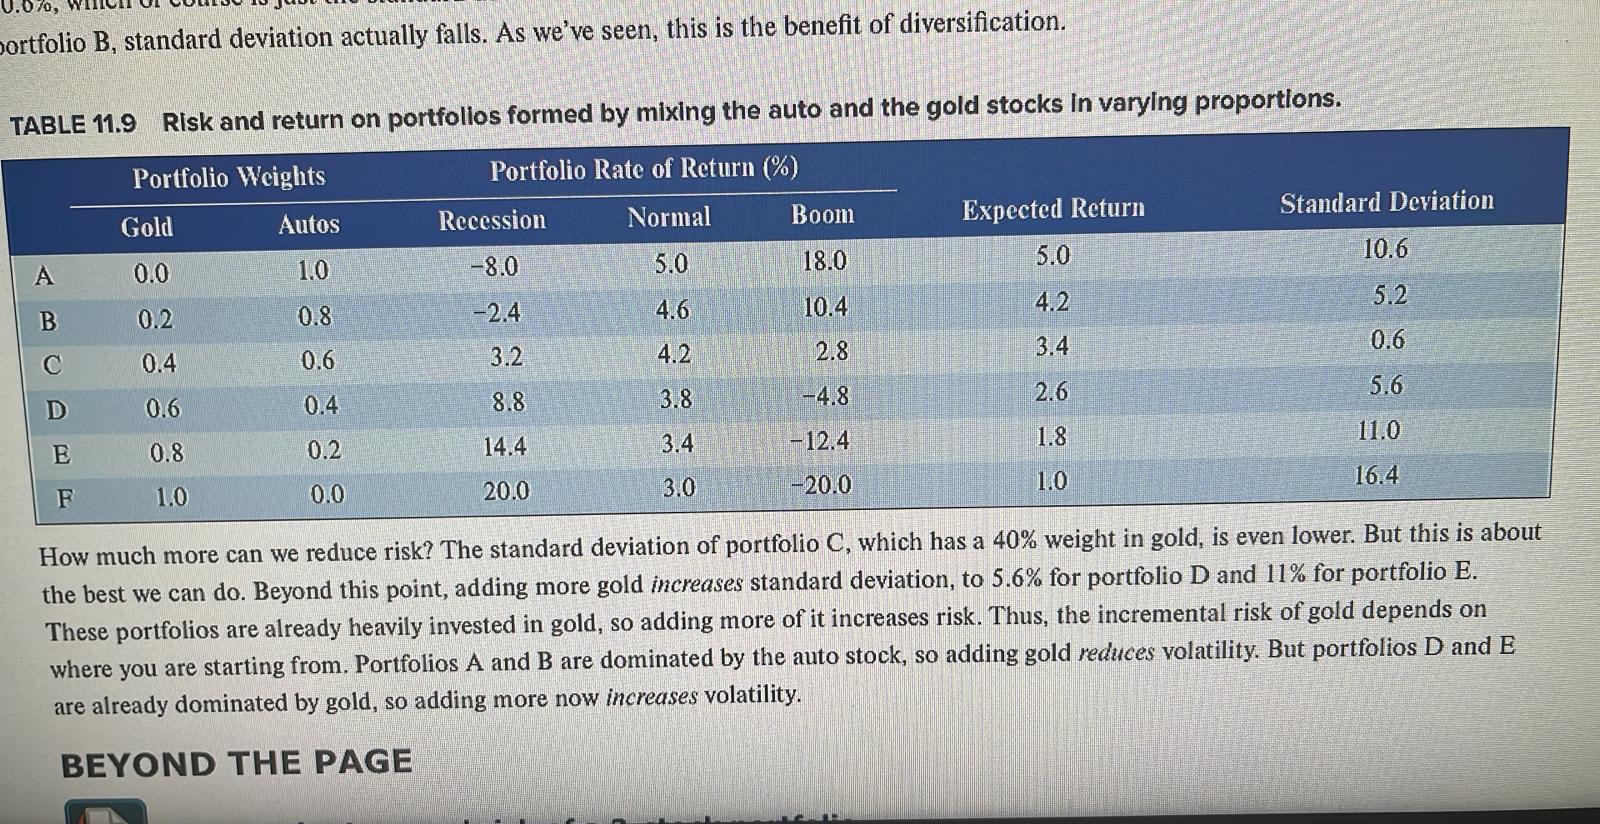
portfolio B, standard deviation actually falls. As we've seen, this is the benefit of diversification. TABLE 11.9 Risk and return on portfolios formed by mixing the auto and the gold stocks in varying proportions. Portfolio Weights Portfolio Rate of Return (%) Gold Autos Recession Normal Boom Expected Return Standard Deviation A 0.0 1.0 -8.0 5.0 18.0 5.0 10.6 B 0.2 0.8 -2.4 4.6 10.4 4.2 5.2 C 0.4 0.6 3.2 4.2 2.8 3.4 0.6 D 0.6 0.4 8.8 3.8 -4.8 2.6 5.6 E 0.8 0.2 14.4 3.4 -12.4 1.8 11.0 F 1.0 0.0 20.0 3.0 -20.0 1.0 16.4 How much more can we reduce risk? The standard deviation of portfolio C, which has a 40% weight in gold, is even lower. But this is about the best we can do. Beyond this point, adding more gold increases standard deviation, to 5.6% for portfolio D and 11% for portfolio E. These portfolios are already heavily invested in gold, so adding more of it increases risk. Thus, the incremental risk of gold depends on where you are starting from. Portfolios A and B are dominated by the auto stock, so adding gold reduces volatility. But portfolios D and E are already dominated by gold, so adding more now increases volatility. BEYOND THE PAGE
Step by Step Solution
There are 3 Steps involved in it

Get step-by-step solutions from verified subject matter experts