

Question: Calculate betas for each subperiod using the Excel SLOPE function. How stable was each companys beta? Suppose that you had used these betas to estimate
Calculate betas for each subperiod using the Excel SLOPE function. How stable was each company’s beta? Suppose that you had used these betas to estimate expected rates of return from the CAPM. (Use the following data rf = 2% and rm − rf = 7%) Would your estimates have changed significantly from subperiod to subperiod and from what you can see in the table above?
Explain what a correlation coefficient is and why it is important. What is the difference between beta and correlation coefficients?
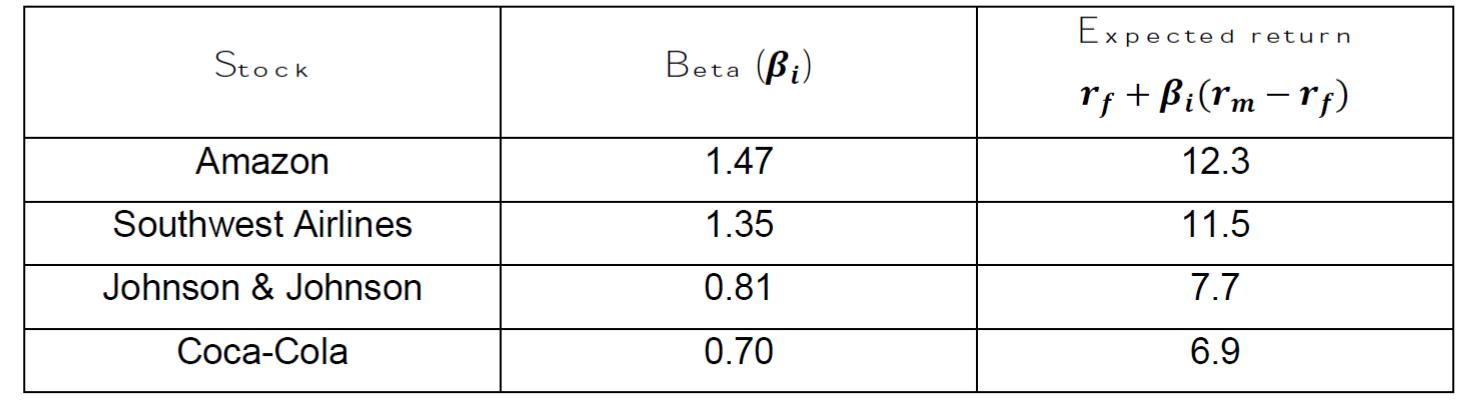
Stock Amazon Southwest Airlines Johnson & Johnson Coca-Cola Beta (Pi) 1.47 1.35 0.81 0.70 Expected return rf + Bi (rm -rf) 12.3 11.5 7.7 6.9
Step by Step Solution
3.46 Rating (153 Votes )
There are 3 Steps involved in it
To answer the question we need the historical returns of each company and the market returns for each subperiod Unfortunately the historical returns are not provided in the given information The stabi... View full answer

Get step-by-step solutions from verified subject matter experts