

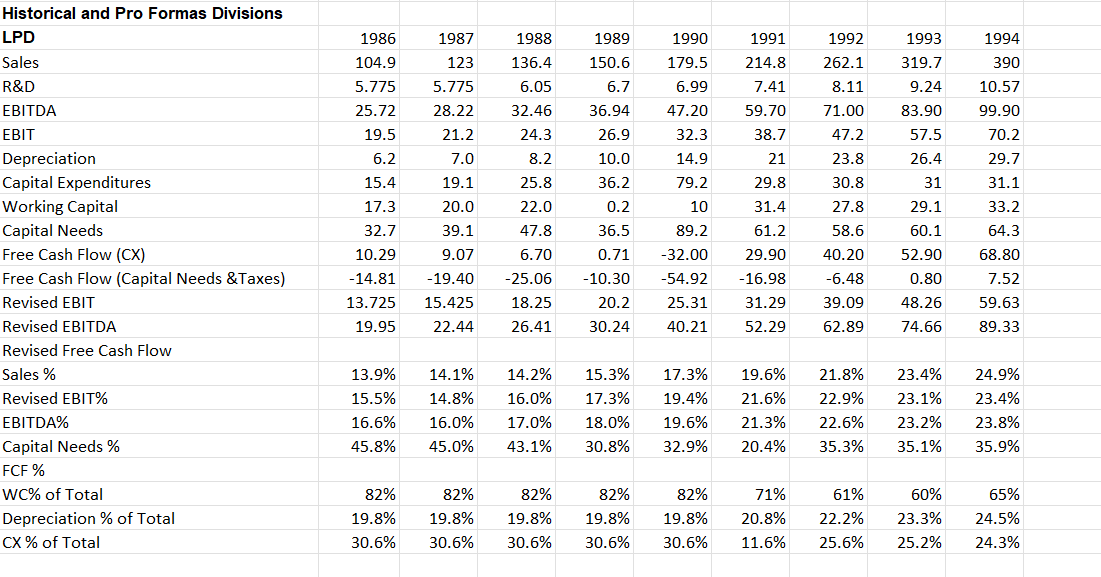
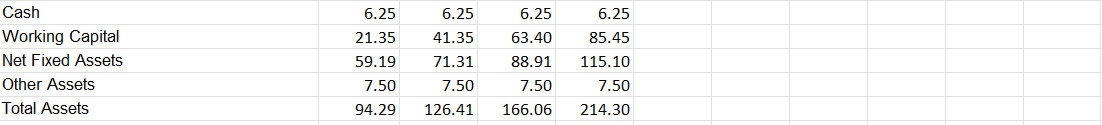
Calculate EVA and CFROI for this Nova division for the 1989-1994 period. Also determine the 'free cash'
Fantastic news! We've Found the answer you've been seeking!
Question:
Calculate EVA and CFROI for this Nova division for the 1989-1994 period. Also determine the 'free cash' flow generated by this division for the 1986-1994 period. (Free cash flow=EBIT+Depr-WC-CX Nova 1989=116.8 +50.8-(.3)-118.3=49.0)
Expert Answer:
To calculate Economic Value Added EVA we need to determine the Net Operating Profit After Taxes NOPAT and the Weighted Average Cost of Capital WACC 1 ... View the full answer

Related Book For 
Cost Accounting A Managerial Emphasis
ISBN: 978-0133392883
6th Canadian edition
Authors: Horngren, Srikant Datar, George Foster, Madhav Rajan, Christ
Posted Date:
