

Question: CALCULATE HORIZONTAL ANALYSIS Horizontal Analysis for Balance Sheet 2019 2020 200,000 100,000 100,000 9,700 10,000 $419,700 60,000 150,000 70,000 500 30,000 $310,500 350,000 70,000) 280,000
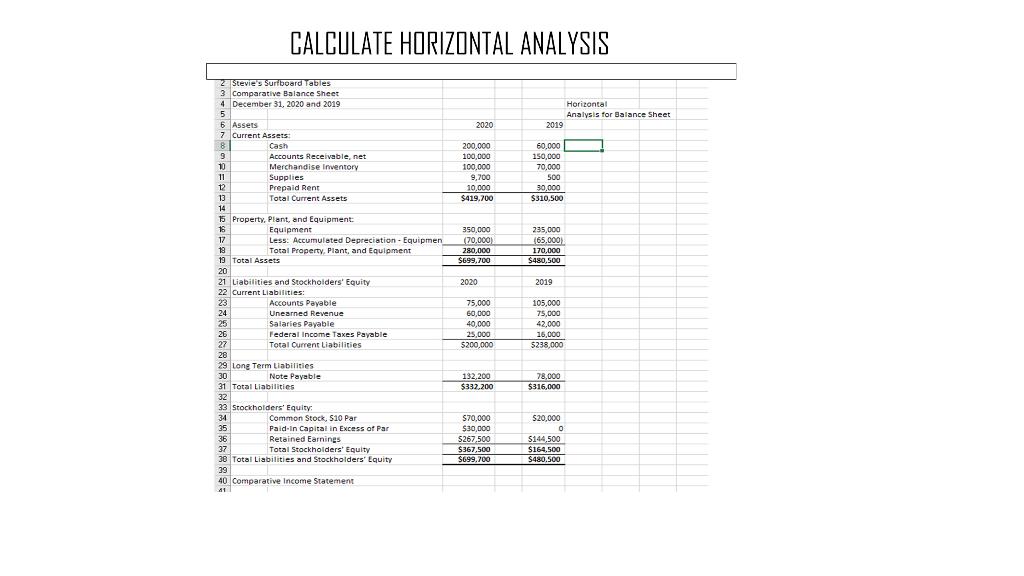
CALCULATE HORIZONTAL ANALYSIS Horizontal Analysis for Balance Sheet 2019 2020 200,000 100,000 100,000 9,700 10,000 $419,700 60,000 150,000 70,000 500 30,000 $310,500 350,000 70,000) 280,000 $699,700 235,000 65.000 170,000 $480,500 Stevie's Surfboard Tables 3 Comparative Balance Sheet 4 December 31, 2020 and 2019 5 6 Assets 7 Current Assets 81 Cash 9 Accounts Receivable, net 0 Merchandise Inventory 11 Supplies 12 Prepaid Rent 13 Total Current Assets 14 15 Property, Plant, and Equipment: 16 Equipment 17 Less: Accumulated Depreciation - Equipmen 18 Total Property, plant, and Equipment 19 Total Assets 20 21 Liabilities and Stockholders' Equity 22 Current Liabilities: 23 Accounts Payable 24 Unearned Revenue 25 Salaries Payable 26 Federal Income Taxes Payable 27 Total Current Liabilities 28 29 Long Term Liabilities 30 Note Payable 31 Total Liabilities 32 33 Stockholders' Equity 34 Common Stock, 510 Par 35 Paid-in Capital in Excess of Pan 36 Retained Earnings 37 Total Stockholders' Equity 38 Total Liabilities and Stockholders' Equity 39 40 Comparative Income Statement 2020 2019 75,000 60,000 40,000 25,000 $200,000 105,000 75,000 42.000 15,000 5238,000 132,200 $332,200 78,000 $316,000 $70,000 $30,000 $267.500 $367,500 $699.700 520,000 0 $144,500 $164,500 $480.500
Step by Step Solution
There are 3 Steps involved in it

Get step-by-step solutions from verified subject matter experts