

Calculate how much you would have in 10 years if you saved $5,000 a year at...
Fantastic news! We've Found the answer you've been seeking!
Question:
Transcribed Image Text:
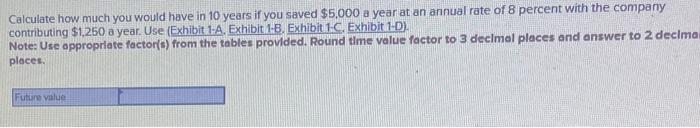
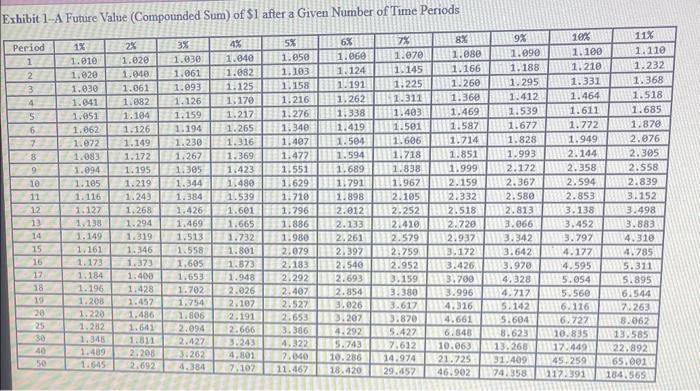
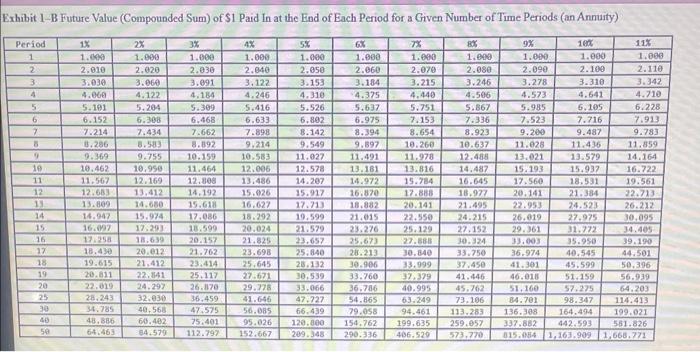
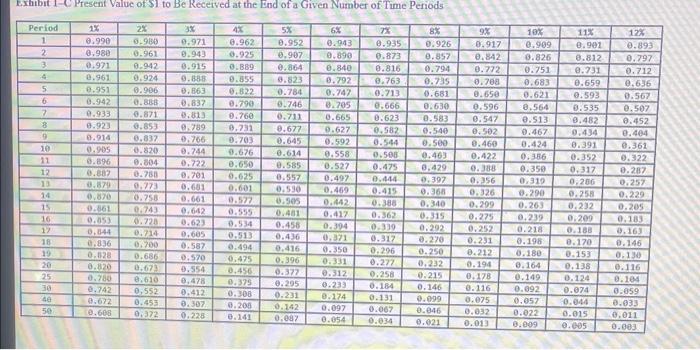
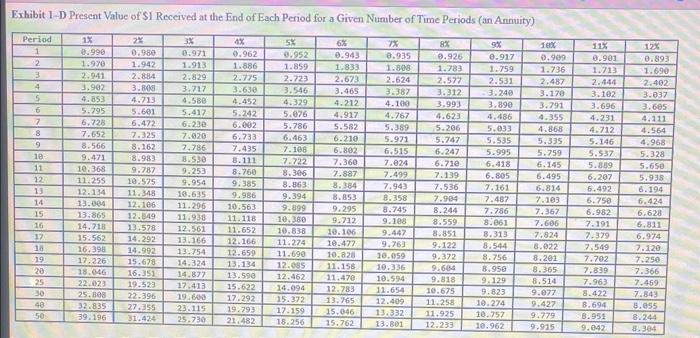
Calculate how much you would have in 10 years if you saved $5,000 a year at an annual rate of 8 percent with the company contributing $1,250 a year. Use (Exhibit 1-A. Exhibit 1-B. Exhibit 1-C. Exhibit 1-D). Note: Use appropriate factor(s) from the tables provided. Round time value factor to 3 decimal places and answer to 2 decimai places. Future value Exhibit 1-A Future Value (Compounded Sum) of $1 after a Given Number of Time Periods Period 6% 1 1.060 1.124 1.191 2 3 4 5 6 7 8 9 10 11 12 13 14 15 16 17 18 19 20 25 30 40 50 1% 1.010 1.020 1.030 1.041 1.051 1.062 1.072 1.083 1.094 1.105 1.116 1.127 1.138 1.149 1.161 1.173 1.184 1.196 1.208 2% 1.020 3% 1.030 1,040, 1.061 1.061 1.093 1.082 1.126 1.104 1.159 1.126 1.194 1.265 1.149) 1.230 1.316 1.369 1.172 1.267 1.195 1.305 1.423 1.219 1.344 1.480 1.243 1.384 1.539 1,268 1,426 1.601 1.294 1.469 1.665 1.319 1.513. 1.732 1.373 1.400 1.346 1.558 1.801 1.605 1.653. 1.948 1.702 2.026 1.754 2.107 1.806 2.191 1.641 2.094 2.666 1.811 3.243 2.292 2.407 2.854 2.527 3.026 2.653 3.207 2.427 3.386 4.292 5.427 4.322 5.743 7,612 7,040 7.107 11.467 2.208 4.801 2.692 10.286 14.974 18.420 29.457 1.428 1.457 1.220 1.486 1.282 1.348 1.489 1.645 4% 1.040 1.082 3.262 4.384 5% 1.050 1.103 1.125 1.158 1.170 1.216 1.217 1.276 7 1.070 1.145 1.873 2.183 8% 1.080 1.166 9% 1.090 1.188 6.848 10.063 21.725 46.902 10% 1.100 1.210 1.331 1.295 1.412 1.464 1.539 1.611 1.225 1.260 1.262 1.311 1.360 1.403 1.469 1,338 1.419 1.501 1.587 1.677 1.340 1.407 1.504 1.606 1.714 1.828 1.477 1.594 1.718 1.851 1.993 2.172 1.838 1.999 2.159 2.367 1.551 1.689 1.629 31.7911.967 1.898 2.105 2.332 2.012 2.252 2.518 2.813 1.710 2.580 1.796 1.886 2.133 2.410 2.720 3.066 1.980 2.261 2.579 2.937 3.342 2.079 2.397 2.759 3.172 3.642 4.177 2.540 2.952 3.426 3.970 4.595 2.693 3.159 3.700 4.328 3.380 3.996 4.717 3.617 4.316 5.142 3.870 4.661 5.604 8.623 10.835 13.585 13.268 17.449 22.892 31.409 45.259 65.001 74.358 117.391 184.565 1.772 1.949 2.144 2.358 2.594 2.853 3.138 3.452 11% 1.110 1.232 1.368 1.518 1.685 1.870. 2.076 2.305 2.558 2.839 3.152 3.498 3.883 3.797 4.310 4.785 5.311 5.0545.895 5.560 6.116 6.727 6.544 7.263 8.062 Exhibit 1-B Future Value (Compounded Sum) of $1 Paid In at the End of Each Period for a Given Number of Time Periods (an Annuity) 4% 5% 3% 1.000 1.000 1.000 2.030 2.040 2.050 3.091 3.122 3.153 4,184 4.246 4.310 5.309 5.526 6.468 6.802 7.662 8.142 8.892 9.549 11.027 12.578 Period 1 2 3 4 5 6 7 8 9 10 11 12 33 14 15 16 17 18 19 20 25 30 40 50 1X 1.000 2.010 3.030 4.060 5.101 6.152 7.214 8.286 9.369 10.462 11.567 12.683 13.809 14.947 16.097 17.258 18.430 19.615 20.811 22.019 28.243 34.785 48.886 64.463 2% 1.000 2.020 3.060 4.122 5.204 6.308 7.434 8.583 9.755 10.950 12.169 13,412 14.680 15.974 17.293 18.639 10.159 11.464 12.808 14.192 15.618 17.086 18.599 20.157 21.762 20.012 21.412 23.414 22.841 25.117 24.297 26.870 32.030 36.459 40.568 47.575 60.402 75.401 64.579 112.797 5.416 6.633 7.898 9.214 10.583 12.006 13.486 15.026 16.627 18.292 20.024 21.825 23.698 25.645 27.671 29.778 41.646 56.085 95.026 152.667 1.000 2.060 3.184 4.375 5.637 6.975 8.394 9.897 11.491 13.181 14.972 16.870 18.882 21.015 23.276 25.673 14.207 15.917 17.713 19.599 21.579 23.657 25.840 28.132 30.539 33.066 47.727 66.439 120.000. 154.762 209.348 290.336 28.213 30.906 33.760 36.786 54.865 79.058 1.000 2.070 3.215 4.440 5.751 7.153 8.654 10.260 11.978 13.816 15.784 17.888 20.141 22.550 25.129 27.888 30,840 1.000 2.080 3.246 4.506 5.867 7.336 8.923 10.637 12.488 14.487 16.645 18.977 21.495 24.215 33.999 37,379 9% 1.000 2.090 3.278 4.573 5.985 7.523 9.200 11.028 13.021 15.193 17.560 20.141 22.953 26.019 29.361 33.003 10% 36.974 41.301 1.000 2.100 3.310 4.641 6.105 7.716 9.487 11.436 13.579 15.937 18.531 21.384 24.523 27.975 31.772 35.950 40.545 45.599 30.095 27.152 34.405 30.324 39.190 33.750 44.501 37.450 50.396 41.446 46.018 56.939 40.995 45.762 51,160 64.203 63.249 73.106 84.701 114.413 94.461 113.283 136.308 199.021 337.882 561.826 199.635 259.057 406.529 573.770 815.084 1,163.909 1,668.771 51.159 57.275 11% 1.000 2.110 3.342 98.347 164.494 442.593 4.710 6.228 7.913 9.783 11.859 14.164 16.722 19.561 22.713 26.212 Exhibit 1-C Present Value of $1 to Be Received at the End of a Given Number of Time Periods Period 1 2 3 4 5 6 7 8 9 10 11 12 13 14 15 16 17 18 19 20 25 30 40 50 1% 0.990 0.980 0.971 0.961 0.951 0.942 9.933 0.923 0.914 0.905 0.896 0.887 0.879 0.870 0.861 0.853 0.844 0.836 0.828 0.820 0.780 0.742 0.672 0.608 2% 0.980 0.961 0.942 0.924 0.906 0.888 0.871 0.853 0.837 0.820 0.804 0.788 0.773 0.758 0.743 0.728 0.714 0.700 0.686 0.673 0.610 0,552 0.453 0.372 3x 0.971 0.943 0.915 0.888 0.863 0.837 0.813 0.789 0.766 0.744 0.722 0.701 0.681 0.661 0.642 0.623 0.605 0.587 0.570 0.554 0,478 0.412 0.307 0.228 4% 5% 6% 0.962 0.952 0.943 0.925 0.907 0.890 0.889 0.864 0.840 0.855 0.823 0.792 0.822 0.784 0.747 0.790 0.746 0.705 0.760 0.711 0.665 0.677 0.627 0.592 0.558 0.527 0.497 0.469 0.442 0.417 0.394 0,371 0.350 0.731 0.703 0.676 0.650 0.625 0.601 0.577 0.555 0.534 0.513 0.494 0.475 0.456 0.375 0.308 0.200 0.141 0.645 0.614 0.585 0.557 0.590 0.505 0.481 0.458 0.436 0.416 0.396 0.377 0.295 0.231 0.142 0.087 0.331 0.312 0.233 0.174 0.097 0.054 7% 0.935 0.873 0.816 0.763 0.713 0.666 0.623 0.582 0.544 0.508 0.475 0.444 0.415 0.388 0.362 0.339 0.317 0.296 0.277 0.258 6.184 0.131 0.067 0.034 8% 0.926 0.857 10% 0.909 0.842 0.826 0.794 0.772 0.751 0.735 0.708 0.683 0.681 0.650 0.621 0.596 8.564 0.547 0.513 0.502 0.467 0.460 0.424 0.422 0.386 0.388 0.350 0.356 0,319 0.290 0.263 0.239 0.218 0.198 0.180 0.164 0.630 0.583 0.540 0.500 0.463 0,429 0.397 0.368 0.340 0.315 0.292 0.270 0.250 0.232 0.215 0.146 0.099 0.046 0.021 9% 0.917 0.326 0.299 0.275 0.252 0.231 0.212 0.194 0.178 0.116 0.075 0.032 0.013 0.149 0.092 0.057 0.022 0.009 11% 0.901 0.812 0.731 0.659 0.593 0.535 8.482 0.434 0.391 0.352 0.317 0,286 0.258 0.232 0.209 0.188 0.170 0.153 0.138 0.124 0.074 0.044 0.015 0.005 12% 0.893 0.797 0.712 0.636 0.567 0.507 0.452 0.404 0.361 0.322 0.287 0.257 0.229 0.205 0.183 0.163 0.146 0.130 0.116 0.104 0.059 0.033 0.011 0.003 Exhibit 1-D Present Value of $1 Received at the End of Each Period for a Given Number of Time Periods (an Annuity) 1X 0.990 1.970 2.941 Period 1 2 3 4 5 6 7 8 9 18- 11 12 13 14 15 16 17 18 19 20 25 30 48 50 3.902 4.853 5.795 6,728 7.652 8.566 9.471 10.368 11.255 2% 0.980 1.942 2.884 3.806 4.713 5.601 6.472 7.325 8.162 8.983 9.787 10.575 12.134 11.348 13.004 12.106 13.865 12.849 14.718 13.578 15.562 14.292 16.398 14.992 17,226 18.046 22.023 25.808 32.835 39.196 15.678 16.351 19.523 22.396 27.355 31.424 4% 0.962 1.886 2.775 3.630 4.452 5.242 6.002 6.733 7.435 8.111 8.760 9.954 9.385 10.635 9.986 11.296 10.563 11.938 11.118 10,380 12.561 11.652 10.838 13.166 12.166 11.274 13.754 12.659 11.690 10.828 14.324 13.134 12.085 11.158 14.877 13.590 12.462 11.470 17.413 15.622 14.094 12.783 19.600 17.292 15.372 23.115 19.793 17.159 25.730 21.482 18.256 3% 0.971 1.913 2.829 3.717 4.580 5.417 6.230 7.020 7.786 8.530 9.253 5% 0.952 1.859 2.723 3.546 4.329 5.076 5.786 6.463 7.108 7.722 8.306 8.863 9.394 9.899 6% 0.943 1.833 2.673 3.465 4.212 4.917 5.582 6.210 6.802 7.360 7.887 8.384 8.853 9.295 9.712 10.106 10.477 13.765 15,046 15.762 7% 0.935 1.808 2.624 3.387 4.100 4.767 5.389 5.971 6.515 7.024 7.499 7.943 8.358 8.745 9.108 9.447 9.763 10.059 10.336 10.594 11.654 12.409 13.332 13.801 8% 0.926 1.783 2.577 3.312 3.993 4.623 5.206 5.747 6.247 6.710 7.139 7.536 7.904 8.244 8.559 8.851 9.122 9.372 9.604 9.818 10.675 11.258 11.925 12.293 9% 0.917 1.759 2.531 3.240 3.890 4.486 5.033 5.535 5.995 6.418 6.805 7.161 7.487 7.786 8.061 8.313 8.544 8.756 8.950 9.129 9.823 10.274 10.757 10.962 10% 0.909 1.736 2,487 3.170 3.791 4.355 4.868 5.335 5.759 6.145 6.495 6.814 7.103 7.367 7.606 7.824 8.922 8.201 8.365 8.514 9.077 9.427 9.779 9.915 11% 0.901 1.713 2.444 3.102 3.696 4.231 4.712 5.146 5.537 5.889 6.207 6.492 6.750 6.982 7.191 7.379 7,549 7.702 7.839 7.963 8.422 8.694 8.951 9.042 12% 0.893 1.690 2.402 3.037 3.605 4.111 4.564 4.968 5.328 5.650 5.938 6.194 6.424 6.628 6.811 6.974 7.120 7.250 7.366 7.469 7.843 8.055 8.244 8.304 Calculate how much you would have in 10 years if you saved $5,000 a year at an annual rate of 8 percent with the company contributing $1,250 a year. Use (Exhibit 1-A. Exhibit 1-B. Exhibit 1-C. Exhibit 1-D). Note: Use appropriate factor(s) from the tables provided. Round time value factor to 3 decimal places and answer to 2 decimai places. Future value Exhibit 1-A Future Value (Compounded Sum) of $1 after a Given Number of Time Periods Period 6% 1 1.060 1.124 1.191 2 3 4 5 6 7 8 9 10 11 12 13 14 15 16 17 18 19 20 25 30 40 50 1% 1.010 1.020 1.030 1.041 1.051 1.062 1.072 1.083 1.094 1.105 1.116 1.127 1.138 1.149 1.161 1.173 1.184 1.196 1.208 2% 1.020 3% 1.030 1,040, 1.061 1.061 1.093 1.082 1.126 1.104 1.159 1.126 1.194 1.265 1.149) 1.230 1.316 1.369 1.172 1.267 1.195 1.305 1.423 1.219 1.344 1.480 1.243 1.384 1.539 1,268 1,426 1.601 1.294 1.469 1.665 1.319 1.513. 1.732 1.373 1.400 1.346 1.558 1.801 1.605 1.653. 1.948 1.702 2.026 1.754 2.107 1.806 2.191 1.641 2.094 2.666 1.811 3.243 2.292 2.407 2.854 2.527 3.026 2.653 3.207 2.427 3.386 4.292 5.427 4.322 5.743 7,612 7,040 7.107 11.467 2.208 4.801 2.692 10.286 14.974 18.420 29.457 1.428 1.457 1.220 1.486 1.282 1.348 1.489 1.645 4% 1.040 1.082 3.262 4.384 5% 1.050 1.103 1.125 1.158 1.170 1.216 1.217 1.276 7 1.070 1.145 1.873 2.183 8% 1.080 1.166 9% 1.090 1.188 6.848 10.063 21.725 46.902 10% 1.100 1.210 1.331 1.295 1.412 1.464 1.539 1.611 1.225 1.260 1.262 1.311 1.360 1.403 1.469 1,338 1.419 1.501 1.587 1.677 1.340 1.407 1.504 1.606 1.714 1.828 1.477 1.594 1.718 1.851 1.993 2.172 1.838 1.999 2.159 2.367 1.551 1.689 1.629 31.7911.967 1.898 2.105 2.332 2.012 2.252 2.518 2.813 1.710 2.580 1.796 1.886 2.133 2.410 2.720 3.066 1.980 2.261 2.579 2.937 3.342 2.079 2.397 2.759 3.172 3.642 4.177 2.540 2.952 3.426 3.970 4.595 2.693 3.159 3.700 4.328 3.380 3.996 4.717 3.617 4.316 5.142 3.870 4.661 5.604 8.623 10.835 13.585 13.268 17.449 22.892 31.409 45.259 65.001 74.358 117.391 184.565 1.772 1.949 2.144 2.358 2.594 2.853 3.138 3.452 11% 1.110 1.232 1.368 1.518 1.685 1.870. 2.076 2.305 2.558 2.839 3.152 3.498 3.883 3.797 4.310 4.785 5.311 5.0545.895 5.560 6.116 6.727 6.544 7.263 8.062 Exhibit 1-B Future Value (Compounded Sum) of $1 Paid In at the End of Each Period for a Given Number of Time Periods (an Annuity) 4% 5% 3% 1.000 1.000 1.000 2.030 2.040 2.050 3.091 3.122 3.153 4,184 4.246 4.310 5.309 5.526 6.468 6.802 7.662 8.142 8.892 9.549 11.027 12.578 Period 1 2 3 4 5 6 7 8 9 10 11 12 33 14 15 16 17 18 19 20 25 30 40 50 1X 1.000 2.010 3.030 4.060 5.101 6.152 7.214 8.286 9.369 10.462 11.567 12.683 13.809 14.947 16.097 17.258 18.430 19.615 20.811 22.019 28.243 34.785 48.886 64.463 2% 1.000 2.020 3.060 4.122 5.204 6.308 7.434 8.583 9.755 10.950 12.169 13,412 14.680 15.974 17.293 18.639 10.159 11.464 12.808 14.192 15.618 17.086 18.599 20.157 21.762 20.012 21.412 23.414 22.841 25.117 24.297 26.870 32.030 36.459 40.568 47.575 60.402 75.401 64.579 112.797 5.416 6.633 7.898 9.214 10.583 12.006 13.486 15.026 16.627 18.292 20.024 21.825 23.698 25.645 27.671 29.778 41.646 56.085 95.026 152.667 1.000 2.060 3.184 4.375 5.637 6.975 8.394 9.897 11.491 13.181 14.972 16.870 18.882 21.015 23.276 25.673 14.207 15.917 17.713 19.599 21.579 23.657 25.840 28.132 30.539 33.066 47.727 66.439 120.000. 154.762 209.348 290.336 28.213 30.906 33.760 36.786 54.865 79.058 1.000 2.070 3.215 4.440 5.751 7.153 8.654 10.260 11.978 13.816 15.784 17.888 20.141 22.550 25.129 27.888 30,840 1.000 2.080 3.246 4.506 5.867 7.336 8.923 10.637 12.488 14.487 16.645 18.977 21.495 24.215 33.999 37,379 9% 1.000 2.090 3.278 4.573 5.985 7.523 9.200 11.028 13.021 15.193 17.560 20.141 22.953 26.019 29.361 33.003 10% 36.974 41.301 1.000 2.100 3.310 4.641 6.105 7.716 9.487 11.436 13.579 15.937 18.531 21.384 24.523 27.975 31.772 35.950 40.545 45.599 30.095 27.152 34.405 30.324 39.190 33.750 44.501 37.450 50.396 41.446 46.018 56.939 40.995 45.762 51,160 64.203 63.249 73.106 84.701 114.413 94.461 113.283 136.308 199.021 337.882 561.826 199.635 259.057 406.529 573.770 815.084 1,163.909 1,668.771 51.159 57.275 11% 1.000 2.110 3.342 98.347 164.494 442.593 4.710 6.228 7.913 9.783 11.859 14.164 16.722 19.561 22.713 26.212 Exhibit 1-C Present Value of $1 to Be Received at the End of a Given Number of Time Periods Period 1 2 3 4 5 6 7 8 9 10 11 12 13 14 15 16 17 18 19 20 25 30 40 50 1% 0.990 0.980 0.971 0.961 0.951 0.942 9.933 0.923 0.914 0.905 0.896 0.887 0.879 0.870 0.861 0.853 0.844 0.836 0.828 0.820 0.780 0.742 0.672 0.608 2% 0.980 0.961 0.942 0.924 0.906 0.888 0.871 0.853 0.837 0.820 0.804 0.788 0.773 0.758 0.743 0.728 0.714 0.700 0.686 0.673 0.610 0,552 0.453 0.372 3x 0.971 0.943 0.915 0.888 0.863 0.837 0.813 0.789 0.766 0.744 0.722 0.701 0.681 0.661 0.642 0.623 0.605 0.587 0.570 0.554 0,478 0.412 0.307 0.228 4% 5% 6% 0.962 0.952 0.943 0.925 0.907 0.890 0.889 0.864 0.840 0.855 0.823 0.792 0.822 0.784 0.747 0.790 0.746 0.705 0.760 0.711 0.665 0.677 0.627 0.592 0.558 0.527 0.497 0.469 0.442 0.417 0.394 0,371 0.350 0.731 0.703 0.676 0.650 0.625 0.601 0.577 0.555 0.534 0.513 0.494 0.475 0.456 0.375 0.308 0.200 0.141 0.645 0.614 0.585 0.557 0.590 0.505 0.481 0.458 0.436 0.416 0.396 0.377 0.295 0.231 0.142 0.087 0.331 0.312 0.233 0.174 0.097 0.054 7% 0.935 0.873 0.816 0.763 0.713 0.666 0.623 0.582 0.544 0.508 0.475 0.444 0.415 0.388 0.362 0.339 0.317 0.296 0.277 0.258 6.184 0.131 0.067 0.034 8% 0.926 0.857 10% 0.909 0.842 0.826 0.794 0.772 0.751 0.735 0.708 0.683 0.681 0.650 0.621 0.596 8.564 0.547 0.513 0.502 0.467 0.460 0.424 0.422 0.386 0.388 0.350 0.356 0,319 0.290 0.263 0.239 0.218 0.198 0.180 0.164 0.630 0.583 0.540 0.500 0.463 0,429 0.397 0.368 0.340 0.315 0.292 0.270 0.250 0.232 0.215 0.146 0.099 0.046 0.021 9% 0.917 0.326 0.299 0.275 0.252 0.231 0.212 0.194 0.178 0.116 0.075 0.032 0.013 0.149 0.092 0.057 0.022 0.009 11% 0.901 0.812 0.731 0.659 0.593 0.535 8.482 0.434 0.391 0.352 0.317 0,286 0.258 0.232 0.209 0.188 0.170 0.153 0.138 0.124 0.074 0.044 0.015 0.005 12% 0.893 0.797 0.712 0.636 0.567 0.507 0.452 0.404 0.361 0.322 0.287 0.257 0.229 0.205 0.183 0.163 0.146 0.130 0.116 0.104 0.059 0.033 0.011 0.003 Exhibit 1-D Present Value of $1 Received at the End of Each Period for a Given Number of Time Periods (an Annuity) 1X 0.990 1.970 2.941 Period 1 2 3 4 5 6 7 8 9 18- 11 12 13 14 15 16 17 18 19 20 25 30 48 50 3.902 4.853 5.795 6,728 7.652 8.566 9.471 10.368 11.255 2% 0.980 1.942 2.884 3.806 4.713 5.601 6.472 7.325 8.162 8.983 9.787 10.575 12.134 11.348 13.004 12.106 13.865 12.849 14.718 13.578 15.562 14.292 16.398 14.992 17,226 18.046 22.023 25.808 32.835 39.196 15.678 16.351 19.523 22.396 27.355 31.424 4% 0.962 1.886 2.775 3.630 4.452 5.242 6.002 6.733 7.435 8.111 8.760 9.954 9.385 10.635 9.986 11.296 10.563 11.938 11.118 10,380 12.561 11.652 10.838 13.166 12.166 11.274 13.754 12.659 11.690 10.828 14.324 13.134 12.085 11.158 14.877 13.590 12.462 11.470 17.413 15.622 14.094 12.783 19.600 17.292 15.372 23.115 19.793 17.159 25.730 21.482 18.256 3% 0.971 1.913 2.829 3.717 4.580 5.417 6.230 7.020 7.786 8.530 9.253 5% 0.952 1.859 2.723 3.546 4.329 5.076 5.786 6.463 7.108 7.722 8.306 8.863 9.394 9.899 6% 0.943 1.833 2.673 3.465 4.212 4.917 5.582 6.210 6.802 7.360 7.887 8.384 8.853 9.295 9.712 10.106 10.477 13.765 15,046 15.762 7% 0.935 1.808 2.624 3.387 4.100 4.767 5.389 5.971 6.515 7.024 7.499 7.943 8.358 8.745 9.108 9.447 9.763 10.059 10.336 10.594 11.654 12.409 13.332 13.801 8% 0.926 1.783 2.577 3.312 3.993 4.623 5.206 5.747 6.247 6.710 7.139 7.536 7.904 8.244 8.559 8.851 9.122 9.372 9.604 9.818 10.675 11.258 11.925 12.293 9% 0.917 1.759 2.531 3.240 3.890 4.486 5.033 5.535 5.995 6.418 6.805 7.161 7.487 7.786 8.061 8.313 8.544 8.756 8.950 9.129 9.823 10.274 10.757 10.962 10% 0.909 1.736 2,487 3.170 3.791 4.355 4.868 5.335 5.759 6.145 6.495 6.814 7.103 7.367 7.606 7.824 8.922 8.201 8.365 8.514 9.077 9.427 9.779 9.915 11% 0.901 1.713 2.444 3.102 3.696 4.231 4.712 5.146 5.537 5.889 6.207 6.492 6.750 6.982 7.191 7.379 7,549 7.702 7.839 7.963 8.422 8.694 8.951 9.042 12% 0.893 1.690 2.402 3.037 3.605 4.111 4.564 4.968 5.328 5.650 5.938 6.194 6.424 6.628 6.811 6.974 7.120 7.250 7.366 7.469 7.843 8.055 8.244 8.304
Expert Answer:
Answer rating: 100% (QA)
Future value FV is the value of a sum of money at a future point in time for ... View the full answer

Related Book For 

Personal Finance
ISBN: 978-0077861643
11th edition
Authors: Jack Kapoor, Les Dlabay, Robert J. Hughes
Posted Date:
Students also viewed these finance questions
-
Calculate how much you would have in 10 years if you saved $2,000 a year at an annual rate of 10 percent with the company contributing $500 a year.
-
For each problem, show your work steps. A correct answer with no work shown gets half credit (which means you fail the assignment). An incorrect answer with no work receives 0 credit. With time value...
-
Evaluate the glycerol chemical structure. Which role in an organic system do these molecules play?
-
Figure shows an overhead view of a ring that can rotate about its center like a merry-go-round. Its outer radius R2 is 0.800 m, its inner radius R1 is R2/2.00, its mass M is 8.00 kg, and the mass of...
-
Figure (a) shows two charged particles fixed in place on an x axis with separation L. The ratio q1/q2 of their charge magnitudes is 4.00. Figure (b) shows the x component Enet,x of their net electric...
-
When a washing machine, of mass \(200 \mathrm{~kg}\) and an unbalance \(0.02 \mathrm{~kg}\) - \(\mathrm{m}\), is mounted on an isolator, the isolator deflects by \(5 \mathrm{~mm}\) under the static...
-
MC Electronics is considering two plans for raising \(\$ 1,000,000\) to expand operations. Plan A is to issue \(9 \%\) bonds payable, and plan B is to issue 100,000 shares of common stock. Before any...
-
In early January 2013, Strawberry Corporation applied for a trade name, incurring legal costs of $50,000. In January 2014, Strawberry incurred $20,000 of legal fees in a successful defense of its...
-
1. Market anomalies refer to certain stock/firm characteristics that have predictive power for the cross-sectional stock returns and such predictability cannot be explained by the risk factors. a)...
-
Please complete the Express Catering, Inc.s 2014 tax return based upon the information provided below. If required information is missing, use reasonable assumptions to fill in the gaps. Ignore any...
-
The accounting department received an invoice of $3,890, plus $24.75 of interest. If the simple interest rate charged in the invoice was at a rate of 4.5%, how many days' interest was charged?
-
Ewan began trading on 1 April 2020. A brief summary of his income statement for the year to 31 March 2021 (prepared on the accruals basis) is as follows: Notes: 1. Trade receivables at 31 March 2021...
-
What is true of the following? (Choose three.) A. If filling in the blank with method x, the code outputs Caught it. B. If filling in the blank with method x, the code prints a stack trace. C. If...
-
In what ways do you think taxation and expenditure systems in developing countries could be improved? Be specific.
-
What is an industrial district? How might governments of developing countries help them succeed?
-
Which can fill in the blank to have the code print the single digit 9? A. Only mapToDouble B. Only mapToInt C. Only mapToLong D. Both mapToDouble and mapToInt E. mapToDouble, mapToInt, and mapToLong...
-
Describe one example of a good business communication practice you have personally experienced. This can be as a client, a worker or with any interaction with an organisation. What made the...
-
Consider the sections of two circuits illustrated above. Select True or False for all statements.After connecting a and b to a battery, the voltage across R1 always equals the voltage across R2.Rcd...
-
What is a coordination of benefits provision?
-
Beth and Bob Martin have a total take-home pay of $4,000 a month. Their monthly expenses total $2,900. Calculate the amount the couple needs to establish an emergency fund. How did you calculate this...
-
Ted Paulson needed money to pay for unexpected medical bills. To obtain $6,000, he decided to sale some of his shares in the Ridgemoor Capital Appreciation Fund. When he called the investment...
-
__________________ inside the potable water tank(s) pushes the water through distribution lines to the lavatories and galleys.
-
Pneumatic power may be used to back-up hydraulic system components without loss of performance by turning a __________________ pump.
-
What is used to heated potable water on passenger aircraft?

Study smarter with the SolutionInn App